It is working but… there is a lot of drift due to temperature and many other factors not yet understood.
I have implemented temperature compensation which is flattening the curves but not completely. I can see ±500g of variation during a day (±10 °C). And this is still too much…
Unfortunately your findings are typically for this cheapScales with bathroom load sensors. The design is straight forward and very cheap but the result / data quality is not satisfying. And your data is with ±500 g at ±10 °C quite good for this sensor type compared with worse results in the linked thread.
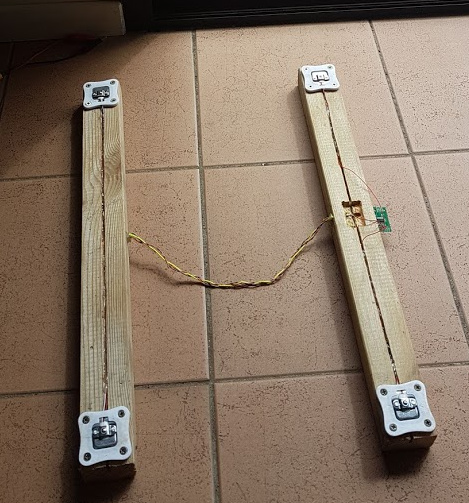
H-frame type or two bars?
All is about compromises. ;-) I Would try the two bar approach, reasons are:
the hive stands firmly on the ground, less waggle compared with a single point load cell
you can use two smaller and cheaper load cells
easy setup with aluminum profiles, spacer plates, no welding needed
The disadvantage is that temperature effects of both load cells will add toghether, so in case you have a single point load cell with ±30 g at ±10 °C you will have ±60 g at ±10 °C with two load cells,
The H-Frame setup is more accurate in case you have the same good or bad load cell model in both setups, you can use one (more expensive and more accurate) load cell but you have to invest in a more stable frame and also in case this is really stable and stiff it will waggle with a heavy hive due to the load cell construction and function principle.
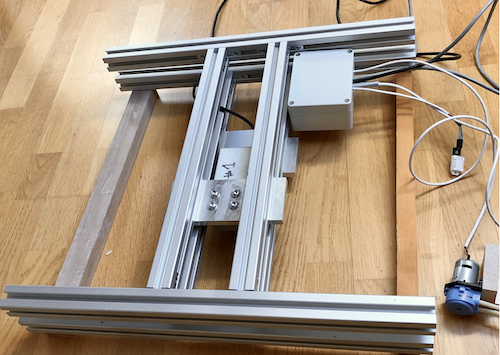
Not much I can share about one versus two load cells. I have tried initially 4 load cells in parallel and have quickly reached the conclusion that the tweaking (balance between the four) was way too complicated. I have then switched to Bosche H40 single load cell in a double H frame. To make the frame I found a very convenient site (motedis.com) where you can find all what you need (I can share my list if needed).
BTW, you can see on the right side a small peristaltic pump that I am using to feed the hives with sirup when need be (my set-up can control 6 hives, which is the number of hives I own and therefore this avoids me to go to the apiary too often to feed the bees)
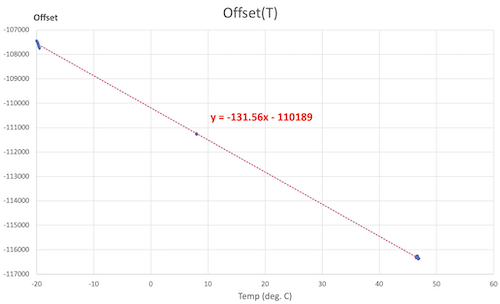
Concerning the H40 load cell, here is what I have learnt: according to Bosche, this kind of load cells is supposed to be “temperature compensated”. In reality it means that the difference between HX711 reading when a load is applied, and HX711 reading when no load is applied (this is often called “Offset”) is independent from temperature. But the Offset IS temperature dependent. In a normal scale, this is not an issue because you first turn the scale on, take a reading before the load is applied (Offset) and then apply the load and take a second reading. In our case, it’s not possible because the load is always applied.
The good news is: Offset seems to be a linear function of the temperature.
The bad news is: the slope of the linear function and the intercept are changing completely upon the load cell unit you are using. You need therefore to calibrate each one separately. If you are lucky you can even find a load cell where the linear function is parallel to X axis (Offset doesn’t change with T).
In order to calibrate, I take a reading of the Offset at 3 different different temperatures because even if I know I am expecting a straight line, this allows me to ensure there is no experiment error. This is actually not as simple as it seems because temperature has to be stable for a long time for the measure to be correct (big inertia). I am using a program that waits until the reading stabilises during a sufficiently long time.
In normal operation, given the temperature inertia of the load cell, the temperature is never perfectly compensated. It may be possible to model the inertia and compensate better but I don’t believe this is really needed.
Hope the helps.
-Henri
I know two wires in one screw terminal is not perfect but it works.
Till now I have not used seperate ADCS for the two load cells, I think it depends on the benefit you get from this. In case both cells are really different respective weight it may be a good idea. My personal oppinion is that you have fluctuating weight on hives outside and perhaps in wooden hives with rain, humidity and so on you have not the lab conditions or at least work bench conditions. So I would doubt that this increasing accuracy will not be relevant for “real life”.
But the setup with two complete independend bars is charming, You have the sensitive part of the wire with analog signals as short as possible in case you put the ADC in the bar and in case you put some electronics in it you can send wireless (e.g. via LoRa) to a central gatewey at your apiary or to a server.
yes mechanically speaking the 2 bars seem better. (better stability)
But the error budget seems twice worse… I still have to be convinced !
BTW why do you choose 200kg loadcells for a single hive (single cell) ? I had in mind that a hive should not weight more than 60kg (Dadant 9 frames full of honey). So 150kg would be enough ?
And 2x80kg for a two bars ?
Problem is dynamic load - not static. You do lift supers off and on the hive and sometimes you drop them - more or less. This will create a high load for a short time which may irreversably damage the load cell (IMHO overload protection of some sort is a must anyway).
The price difference is also not that much.
You loose a bit of precision due to the larger range but I don’t think it matters. YMMV.
Also true is that the error range doubles with two cells. But the median error stays the same if I’m not mistaken.
@clemens already posted links to several discussions in this post above. Its a longish read in German but it goes through several pros and cons of the designs.
Not too sure what to say on those small peristaltic pumps. In my design a raspberry is controlling an I/O board with relays and some of those relays control the pumps. I am using Blynk app to remotely control the relays. See below the customised Blynk app. All this is working OK with following restrictions: 1) the pumps tend to creates glitches in the power supply when they are switched off. Can be easily fixed by adding a diode on the motors 2) obviously you need some power. Not compatible with the low energy connected bee hives 3) the sirup cannot stay forever otherwise it will ferment.
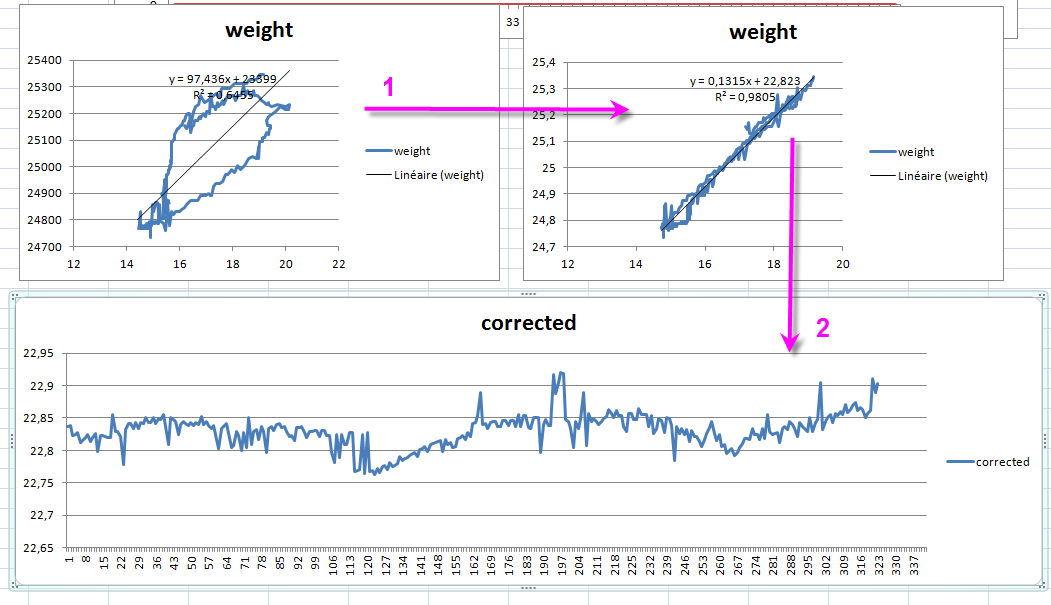
Yes and the implementation is quite easy :
search iteratively for all “magic number” (béta in the formula into the link), compute the linear regression as shown on BeeArfons2.xlsx (59,1 Ko) and my picture and finally select the beta which gives the R2 coefficient closest to one !
Please play with the excel sheet to better understand. “Beta” is in cell G2 (0.04 currently) and see the effect on the curve and on R2 coeff in the second graph.
Then the slope I used is the one given by the linear regression (cell G1)
I have read this excellent thread and a few other (now that I have discovered the german to english button )
I must say that I am more and more tempted by the two bars designs.
After having read I came to the conclusion that the best design was the “T upper bar”. But what I see on other threads is rather the two “L” bars.
It seems to be much simpler, slimmer and cheapper than the “T”. Probably a little more flexible ?
My main concern today is that this 2 bars design is by nature prone to big temperature effects if one side is under sun and the other not (front/back position with front facing south). and I believe that no compensation would work in this case.
I read also that a good target of accuracy would be around 40 to 60g, which seems far from being achievable with the two bars ?
Well finally what kind of monitoring can you see with real two bars installed under a real hive ?
bees living the hive in the morning ?
real weight increasing during the day (or tendency from day to day) ?
nothing accurate due to temperature drift and creeping ?
I am not an express in beekeeping as you may notice
JP
Sorry, I should have phrased that better. I was wondering why you are using pumps to feed the bees?
What is the advantage over using a container of some sorts. You don’t have to open the hive, that is one. But you still have to bring the sugar to the hive and, as you said, you can’t leave it there for very long.
So, why?
Both L & T work. The T has an advantage in stiffness and better resists twisting. That means that you need less material with a T than a L. That in turn means that the T costs about as much as the L.
It comes down to a matter of taste.
Yes, that is true. If the sun is shining on one side you need to protect it. This is why the upper part of the scle is just a bit wider than the lower one. Thus you can screw a piece of wood or somesuch to the side to give some shade.
You can see the bees leaving and returning. You can see the weight increasing during the day and loosing it in the night (due to the drying of the honey).
Maybe someone can point to an existing graph of his?
Well, I’ll tell you more next spring because I haven’t tested it yet. The idea is to maintain a small continuous flow of sirup, days in and days out, in March (except if it’s too cold), when the hive is developing after winter. I cannot afford to go to my apiary every day; the pumps will do the job and I’ll put a new can of sirup about once a week.
I would not recommand the old beelogger “double” design without any sun protection for the load cell. But the new design has parts of the aluminium profile as protection. Also different Variants with L- or T-profiles or U-profiles can be arranged to act es sun protection, see Waage-Konstruktion mit 2 Wägebalken und 130 x 30 x 22 mm Wägezellen
It depends on the load cells! A good one has < 20 g per 10 °C and there are others with much more, see Comparison of Different Load Cells for a 4-Point Scale - #17 by clemens but be aware that I compared a single load cell with a setup of 4 in parallel connected load cells! This is not fair, :-) and in case you spread an error of 100 g to 4 cells you got 25 g for each, so not worse at all.
In case you want to walk through the data take a journey at Grafana
You can also see some “bulgs” at around 16 h at Grafana I thinkt this is a temperature artefact with direct sunlight on the load cells. Just my impression not proofed.
Can you share a little more on how you implemented this compensation ? I read the info on Octopuce web site but couldn’t figure out how to implement. More specifically how is “temperature variation” defined (I suppose this exterior temperature variation over time, but on which time interval ? On the graph, the difference goes from -3 to +13, which tends to indicate that the variation is over a significant time interval).
Once this time interval is defined, how do you compute the corresponding error that you need to remove from your graph 1 to get graph 2 ?
Thanks in advance for any hints you can share !
iterate for formula 1 and compute linear regression formula on the points
select the iteration which maximize the R2 factor of the linear regression
now perform another linear regression while using the corrected temperature and the weights
As step 1 will take into account the “hysteresis” from real temperature to get to the loadcell it means that the computed coefficients will depend on the time sampling interval between two acquisitions.
On my example I do use a 2 minutes interval between points.
If you change this interval you will have to recalibrate
The temperature probe should be as close as possible of the loadcell (in contact with the metal).
The number of points should span on a whole day and you should avoid “partial days”. It means that you shoud have at least a whole cycle and avoid to over represent nights or days which could bias the linear regression. So either 24h or a multiple of 24h.
Do not expect “perfect” results.It’s better than nothing but the loadcells also fluctuate with many other factors which cannot be corrected by simple hysteresis.
This means that these factors shoud be avoided
change of weight
direct sun on the cells
humidity change (no rain at least)
voltage change on the loadcell
To better understand the effect of “iterations” try to change cell G3 into the excel sheet and look at how the curve changes. The optimum (straight line) is when R2 is maximum.
Thanks much JP.
Sorry I was on another topic and I am coming back to this post only now…
What you are doing is clever: it avoids the real calibration that I am doing (measuring weight precisely in a chamber at different stabilised temperatures) for determining the slope of weight(T). What still puzzles me is how you determine the 0.04 factor that you apply to temperature difference between previously load cell temperature and current outside temperature: D3=D2 + (B3-D2)*$G$3. Where is $G$3 coming from ? Thanks !
Henri
well it’s a “brute force” process.
Try with 0.01 compute the linear regression and keep R
then increase to 0,02 and compute again R and keep it
…
At the end, search for the R value which is closest to 1 and you have the optimal value for “$G$3”