Hi Clemens and others that might be interested in Seebeck T-drift compensation,
As introduced in Henri’s topic related to temperature compensation I can present a measuring method to eliminate Seebeck related temperature drift, and I think it is more appropriate to put my approach in this topic since Seebeck related drift was introduced and nicely addressed by Weef.
A few decades ago I was invited to analyze an absurd observation during the battery-charging process using a strain-gauge to measure the pressure built-up inside a battery pack by means of a Wheatstone-bridge. It appeared that the measuring set-up was corrupted in exactly the way Weef described above: for contacting the strain-gauge by 2 different metal-wires, introducing a thermocouple in series with the Wheatstone bridge output, resulting a Seebeck-effect to be mixed with the the strain gauge response. Based on the different origins of those signals, I’ve came to an approach to separate the Seebeck from the Strain-gauge signal, enabling to measure both thermal and mechanical stress of the battery during charging which finally made it into a patent.
I’m not sure if the patent has expired but recently I noticed that HBK is offering an carrier-frequency amplifier (see paragraph 2.4) to read strain-gauges (Load Cells) using the same strategy to eliminate potential Seebeck-drift as claimed by the patent.
I couldn’t find any price on the suggested HBK-amplifier but I’m quite sure it is a manyfold of the HX711 I’m using to read load-cells, for which I got encouraged to find a cheaper and simple way to enable the signal splitting strategy based on simple/cheap components and I can provide 2 tested set-ups here as an alternative to the HBK-amplifier.
So as you can read in the patent the splitting strategy is enabled by the fact that the Seebeck-effect and the Wheatstone-bridge are driven by 2 different sources. The Wheatstone-bridge signal is driven by its source voltage (provided by VAVDD of the HX711) and its respond enables to detect small variation in electrical resistance of the strain-gauges in the load-cell connected to form a Wheatstone-bridge.
On the other hand the Seebeck-effect results from a redistribution of free-electrons in a conducting material driven by the temperature-gradient over the material. This redistribution leads to small voltage gradients and is material depended. As a result 2 wires made from different materials, connected at one end, will end up with a thermo-voltage of several micro-volt per deg C temperature gradient over the 2 wires at the other end. No need to go into deeper details here as you can find more on Seebeck-effect in other publications, but the important take away is that the Seebeck-effect and Wheatstone-bridge might operate at the same voltage-level but are driven by 2 different sources: Temperature gradient (Seebeck-effect) and Source voltage (Wheatstone-bridge). And as a result they can be separated by modulation one of the sources.
I’ll present 2 tested voltage modulation methods:
- Source voltage modulation with the HX711-board with an extension circuit
- Source voltage polarity modulation of the HX-board with a signal relay.
Source Voltage Modulation.
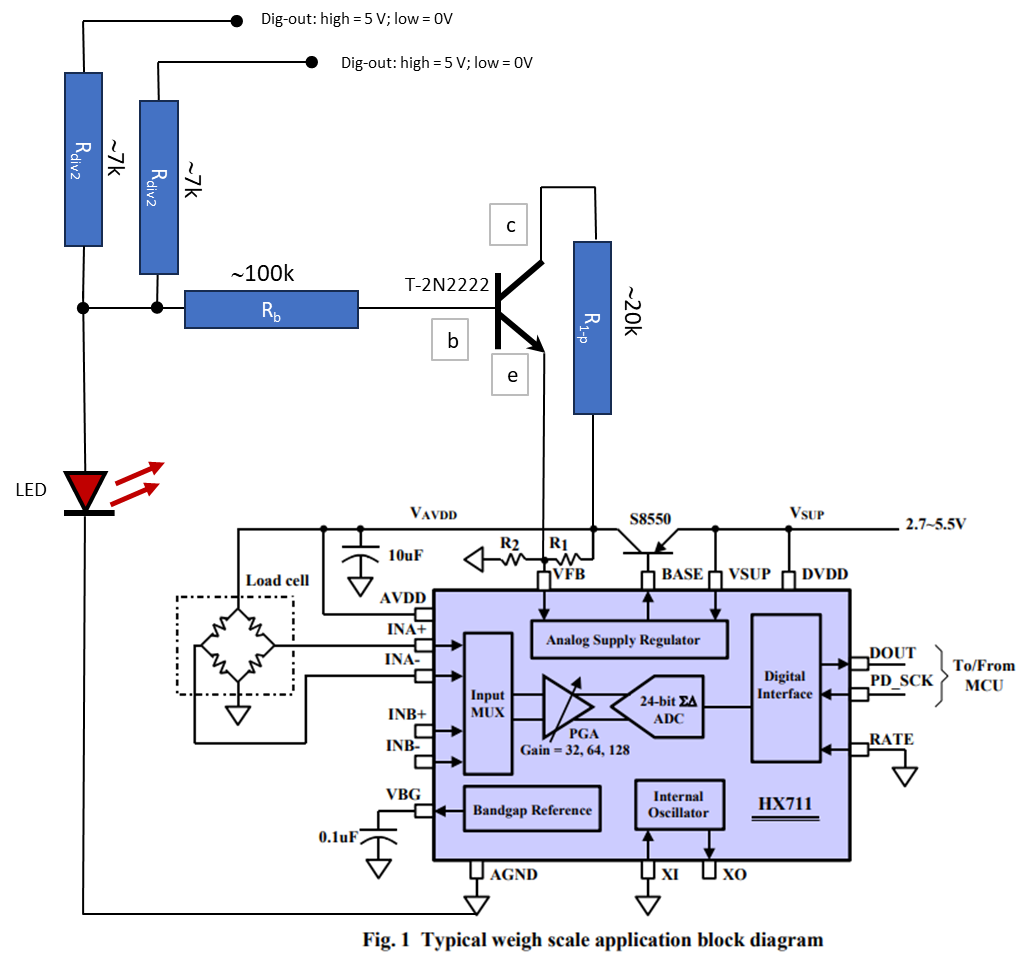
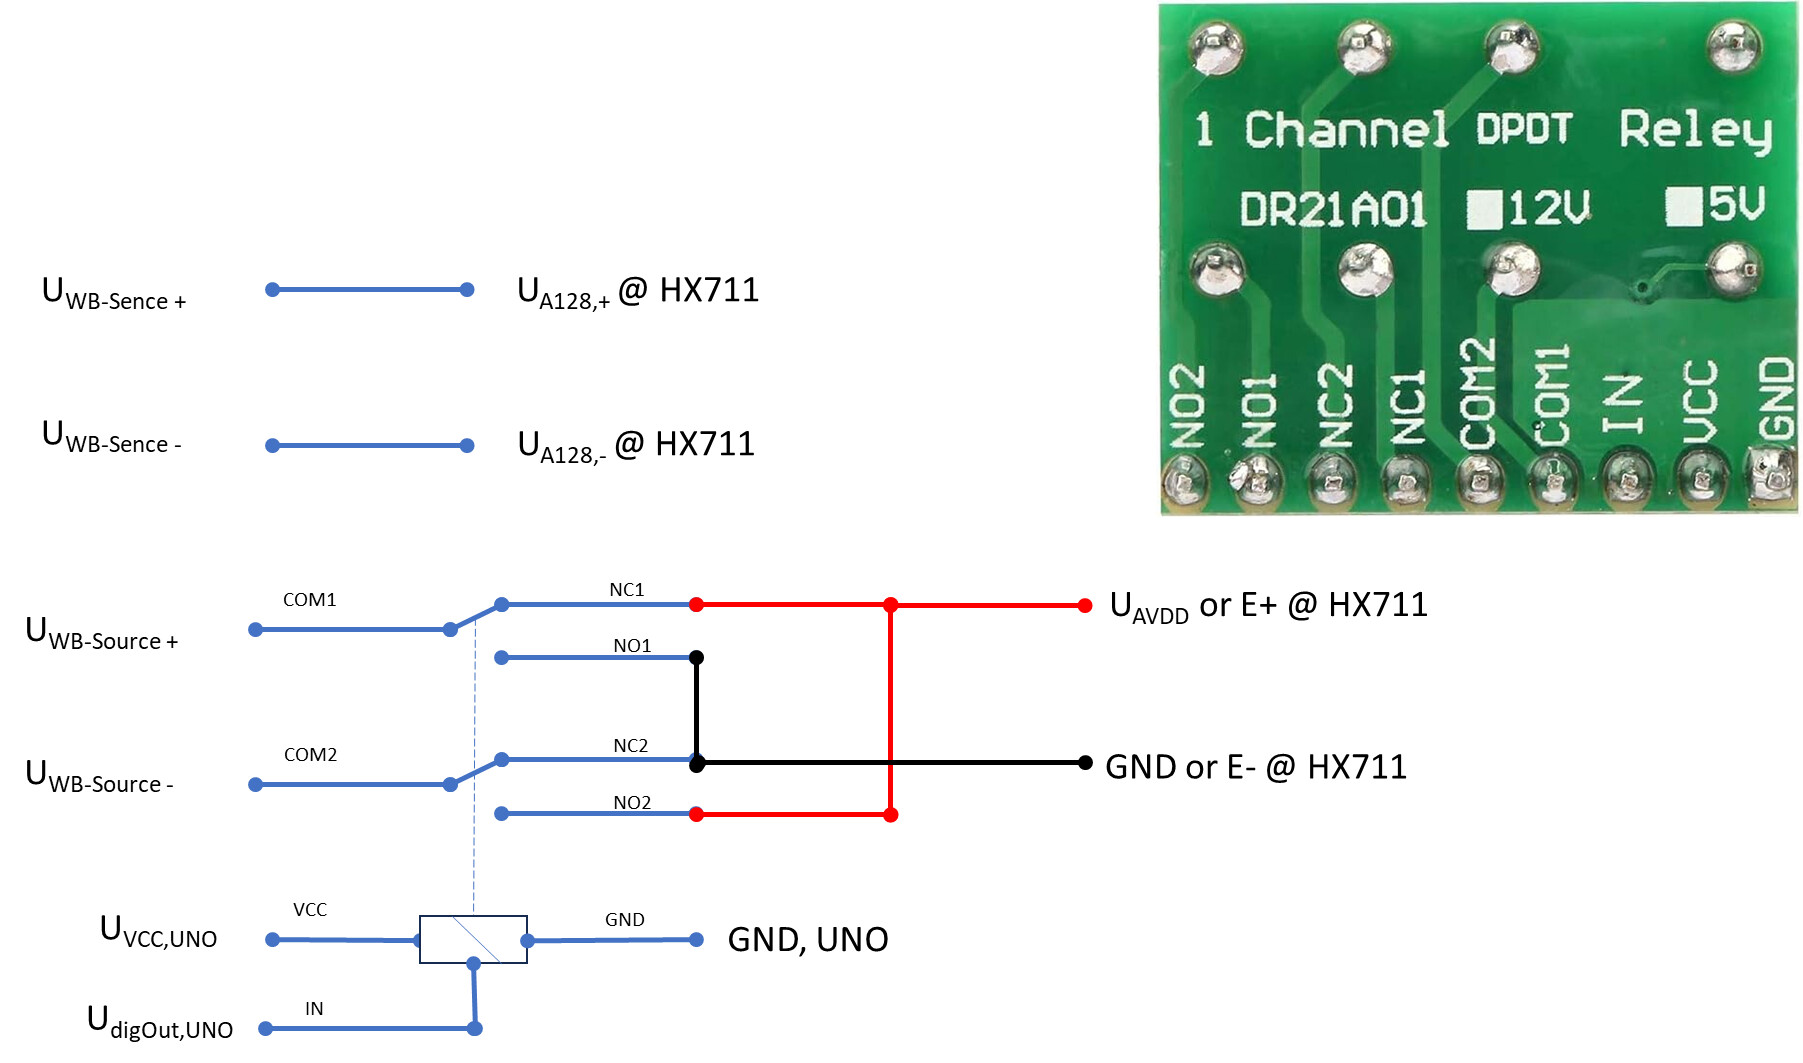
The HX711 datasheet suggests to adapt VAVDD by changing the value of R1 or R2 of the voltage divider that feeds VFB. However, for modulation purpose a software controlled adaptation of VAVDD is required and I succeeded to influence the voltage regulator by ‘injecting’ a small current into the voltage divider on the HX711, from 2 digital outputs on the Arduino UNO board by means of a transistor, a LED and some resistors connected in the circuit below.
By injecting currents at VFB (running to GND via R2) the HX711 analog supply regulator will shift VAVDD to lower values. The LED is there for signaling the modulation status but also helps to reduce noise from the Dig-out or the Arduino UNO on the realized VAVDD. The current injection circuit was build on a breadboard and connected to VFB on the HX711 by a soldered contact.
With this HX711 extension and the above Resistor settings I was able to set the Wheatstone-source voltage from the Arduino code at 4 levels: 4072, 3885, 3563 and 2475 mV by 2 digital outputs, while reading the HX711 ADC at each VAVDD level.
To interpret the response of the modulation you need to consider that the ADC on the HX711 is Ratio-metrical based, so its output-data is proportional to the ratio of the Input-voltage (A+ - A-) and the source voltage (VAVDD at E+ - E-), see table 2 in datasheet. This means for the obtained ADC output-data, the contribution of the Wheatstone-bridge will not vary with the VAVDD-setting, and for the contribution by the Seebeck-effect it will be linear proportional with 1/VAVDD. So you can separate the mixed signals by plotting the ADC-output vs 1/VAVDD.
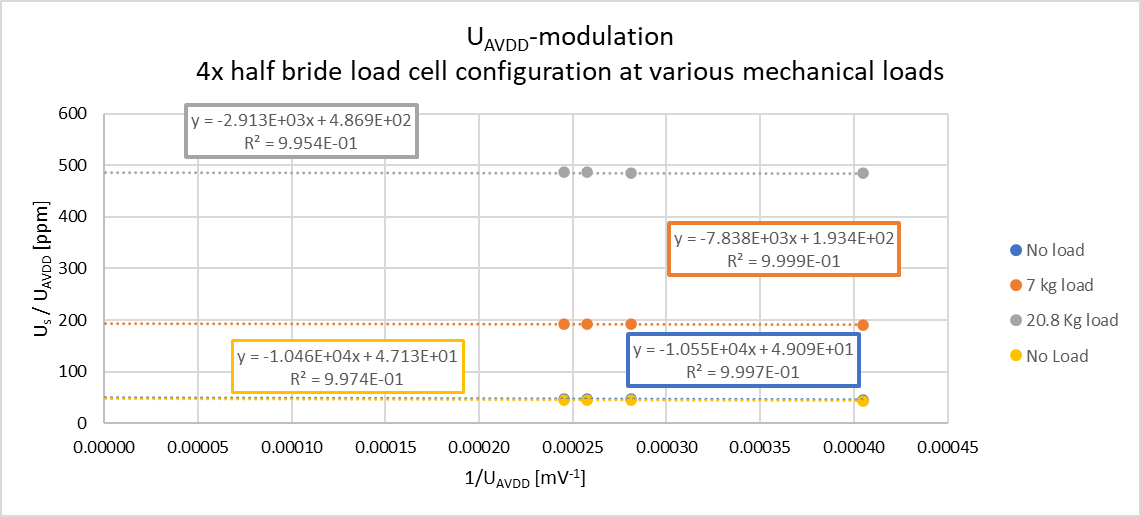
For my 4x half bridge load cell configuration at 3 different (load) conditions this resulted in this modulation responses:
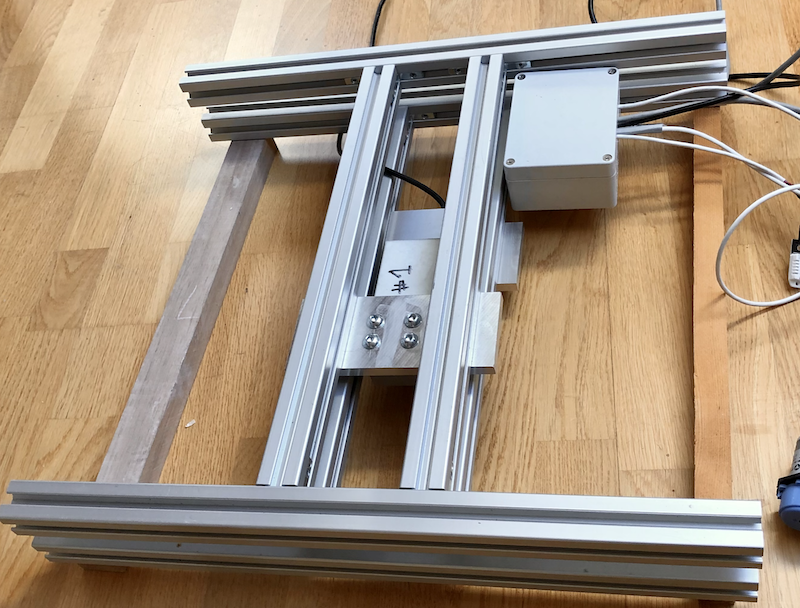
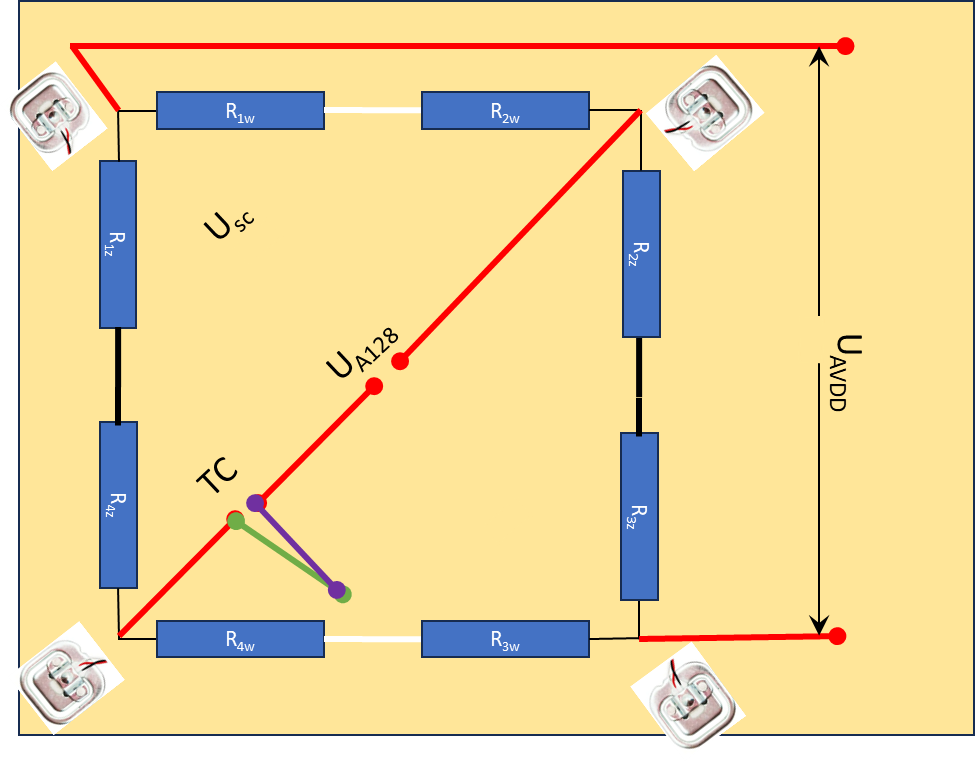
Since the graph shows only little dependency with the 1/VAVDD (VAVDD in the HX711 datasheet is the same as UAVDD for my data graphs, and Us = A+ - A-) you can conclude the ADC-response is almost free from Seebeck-effect. This might be considered good news for the quality of the set-up, but is a rather boring results to demonstrate the separating potential of the Source voltage modulation. Therefore I decided to corrupt my set-up with a [thermocouple] (Thermocouple - Wikipedia) (TC in fig below is of type K providing about 40 micro Volt per K) in series to the Wheatstone-bridge output to provide a controllable source of Seebeck-effect. The level of the Seebeck effect can be adjusted by the temperature gradient over the thermocouple.
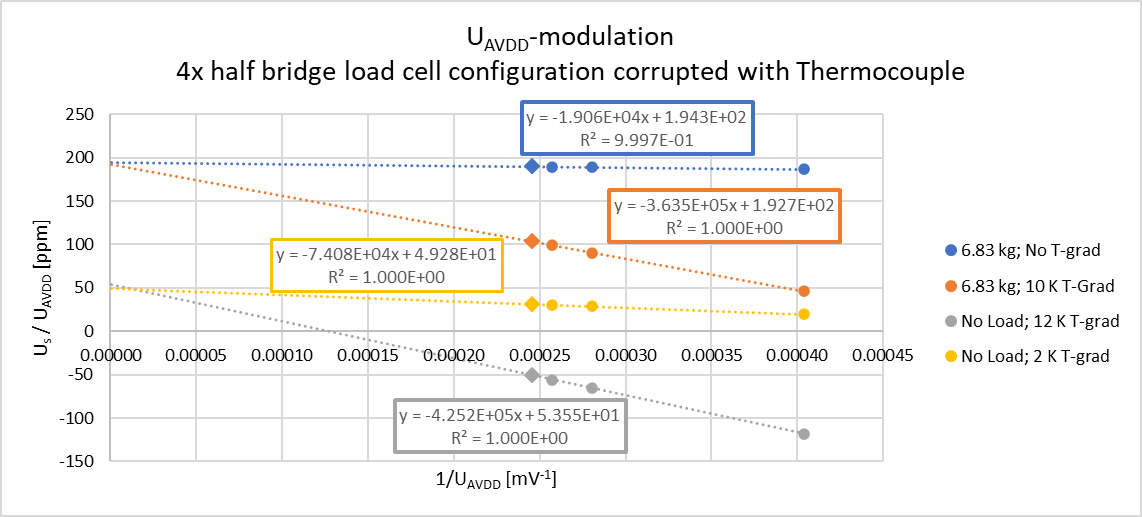
With the VAVDD-modulation for 4 different conditions (2x load combined with 4x thermal), I obtained the modulation results below:
Now the contribution of the TC Seebeck-effect is clearly demonstrated by the dependency with 1/VAVDD. Linear regression of the ADC-output vs 1/VAVDD gives:
- The extrapolated intercept, representing the hypothetical response for 1/VAVDD = 0 or infinite high VAVDD, where the Wheatstone bridge contribution would outrange a few mV by the Seebeck effect.
- The slope representing the Seebeck effect in nV (10^-6 mV)
For example the linear regression for the modulated situation with 6.83 kg mechanical load and 10 K temperature gradient over the TC, reveals an intercept of 192.7 ppm for the Wheatstone bridge load cell contribution and a slope of 3.635 E+5 nV or 0.3635 mV thermo-electrical contribution of the thermocouple (which is close to the equivalent of 10 K temperature gradient for a type K TC). Also can be seen that the, by regression obtained, intercept for the same mechanical loads are more or less the same: 194.3 ppm vs 192.7 ppm for a 6.83 kg load and 49.3 ppm vs 53.6 ppm when no mechanical load on the load cell.
These results demonstrates that VAVDD-modulation is capable in separating the Seebeck effect from the Load contribution in the HX711 ADC-response, although there might be some room for improvement since the obtained intercept values for equal loads shows some variation in the order of few ppm (equivalent of few 0.1 kg for this set-up). But without the modulation, only the diamond points in the graph would be available showing the Seebeck effect contribution was up to 100 ppm @ default VAVDD of about 4072 mV (1/VAVDD = 0.000246 mV^-1). On the other hand this might also be related to the load cell drift during the test.
Polarity modulation
To enable the Wheatstone-bridge Source voltage polarity modulation I chose for 1 channel double polarity signal relay with Normal Open and Normal Close contacts, to be connected between the Wheatstone bridge and the HX in the figure below.
This way the polarity can be software controlled from the Arduino code by the one of the dig-outputs of the Arduino UNO, while the HX711 ADC is read for each polarity (U_A128 = A+ - A-).
Now what can we expect from the ADC-output: the contribution of the Wheatstone-bridge will flip polarity in sync with the polarity of the Source voltage VAVDD, while the contribution of the Seebeck effect remains at the same polarity independent of the Source voltage polarity. So if you subtract the ADC-output for both polarities you’ll end up with 2x the Wheatstone-bridge contribution and if you add-up the ADC-output for both polarities you’ll end up with 2x the Seebeck contribution.
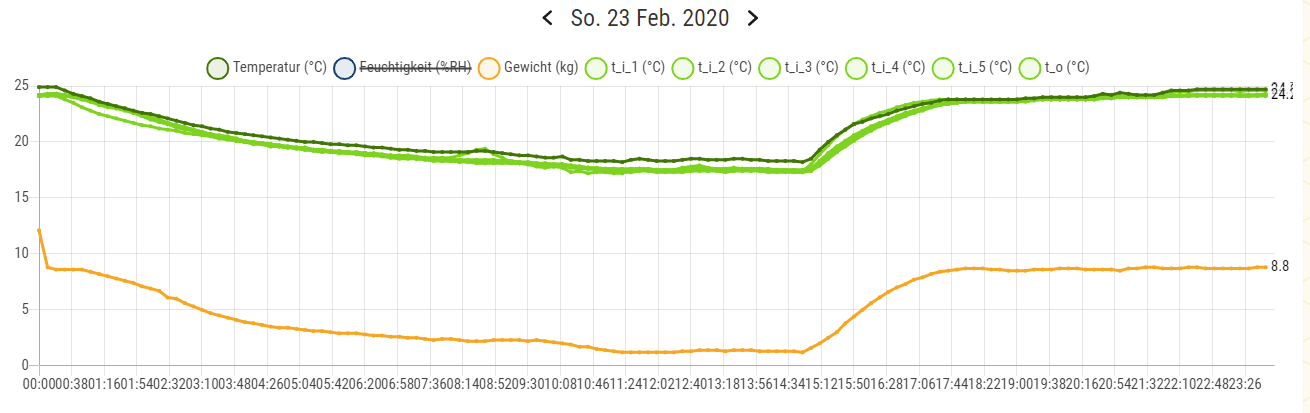
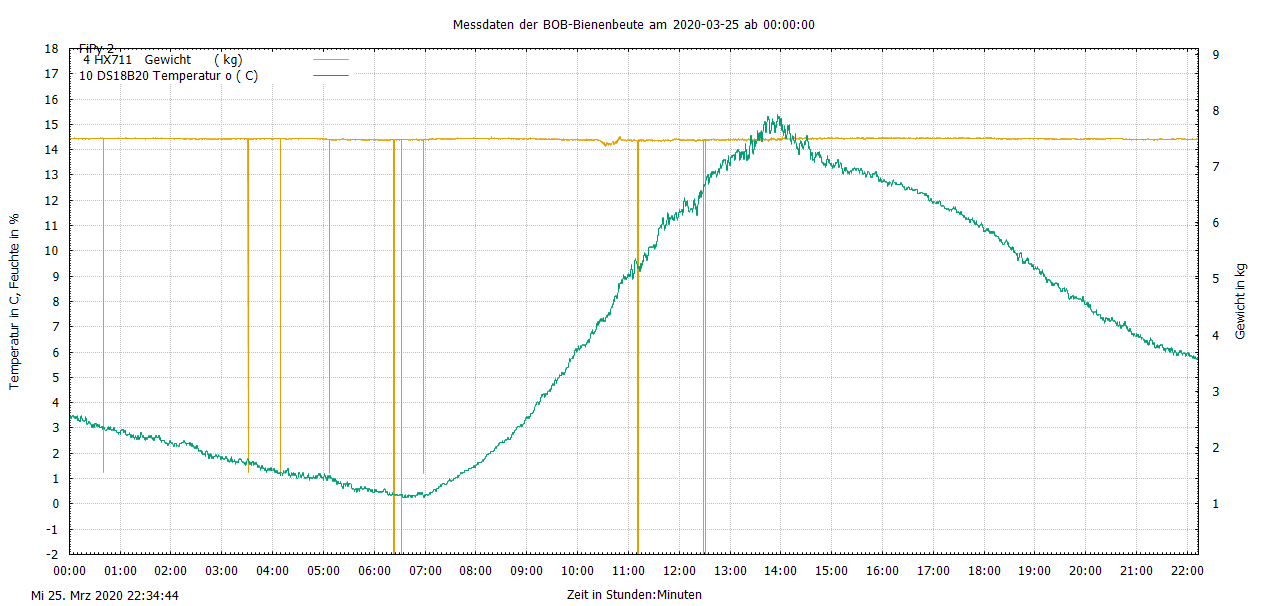
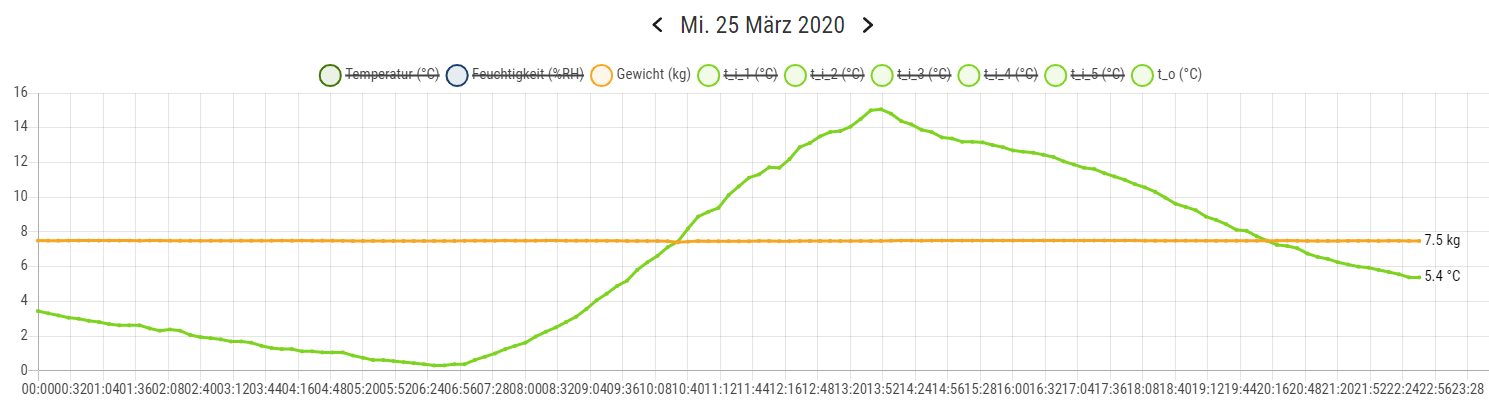
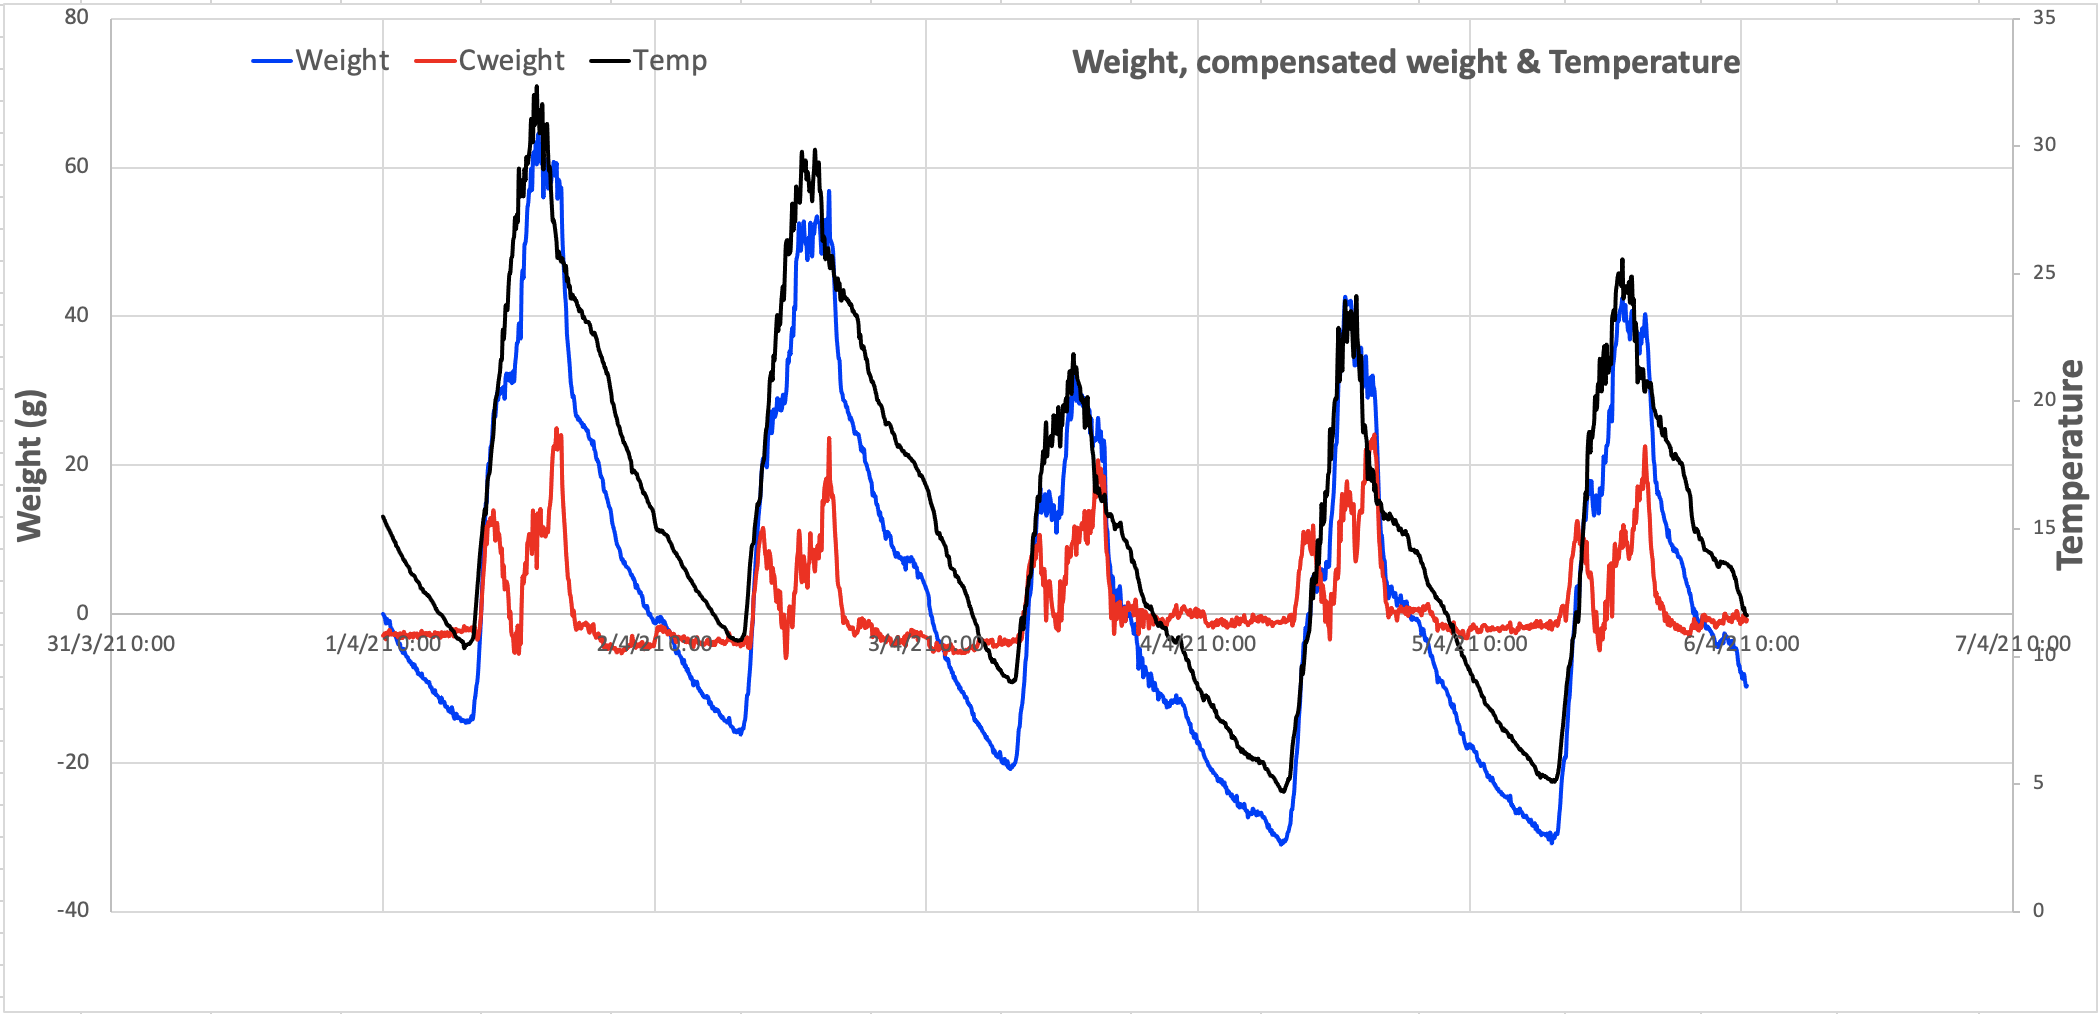
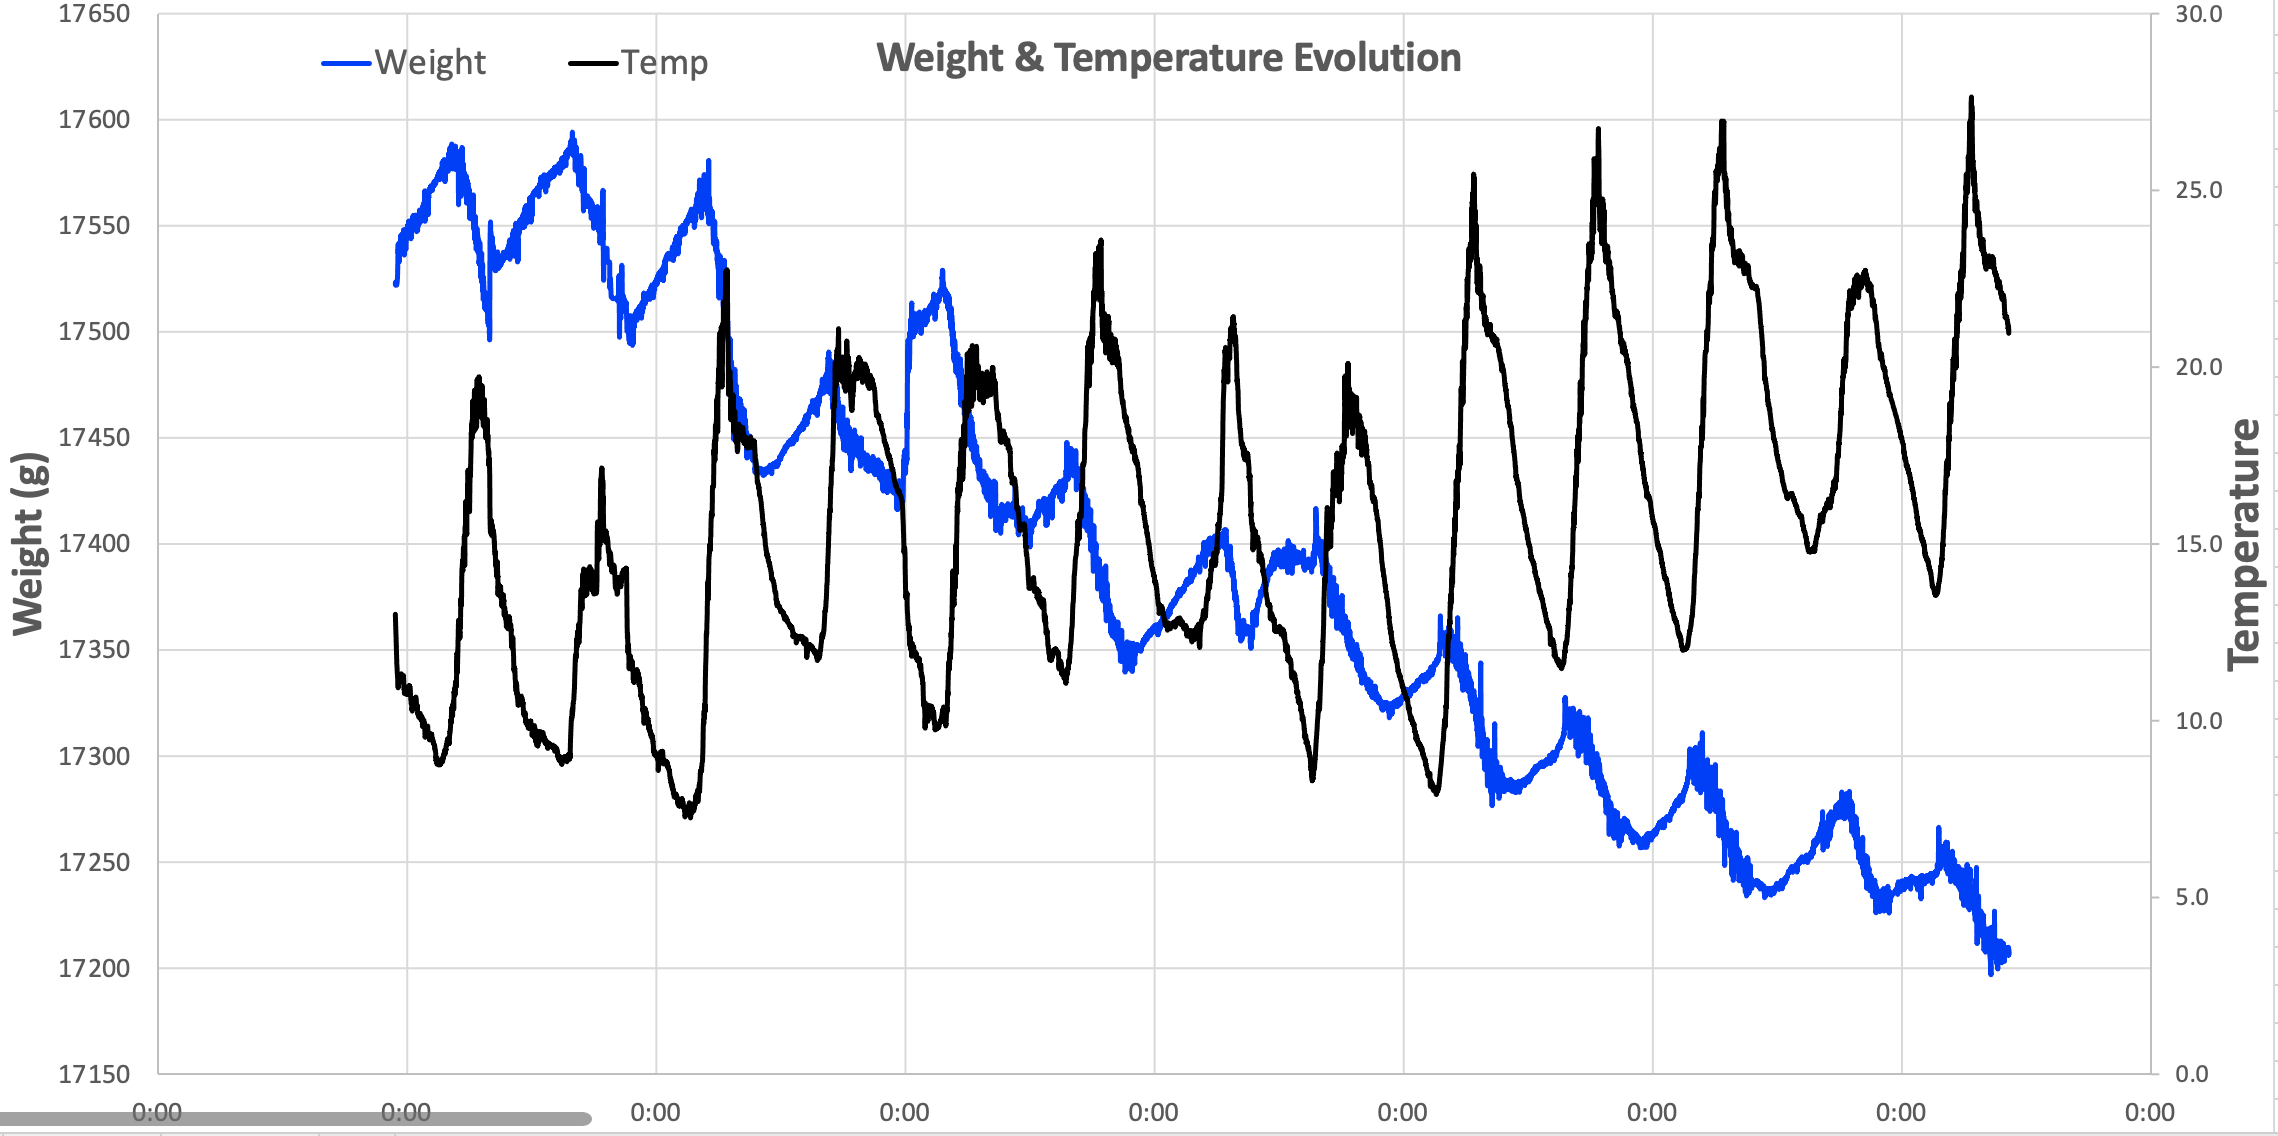
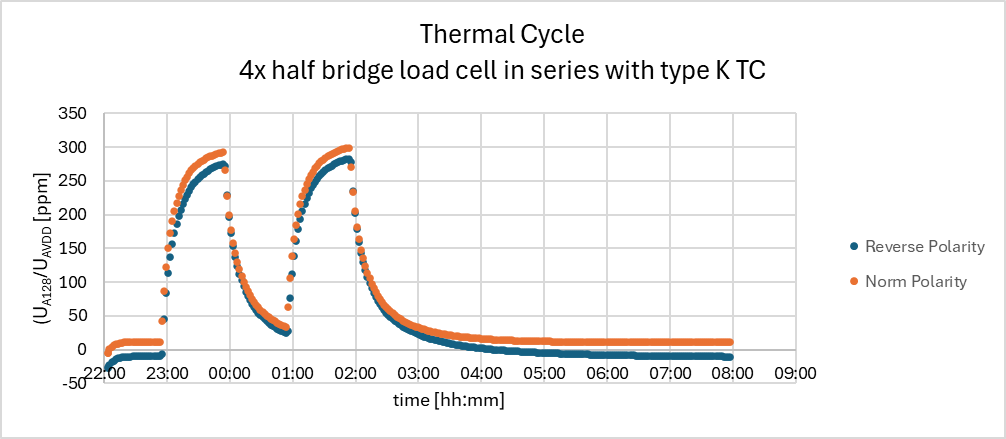
Below the recorded response of the corrupted set-up with both the load cells and the thermocouple exposed to 2x thermal cycles (heat-up to 40 deg C and cooldown to room temperature).
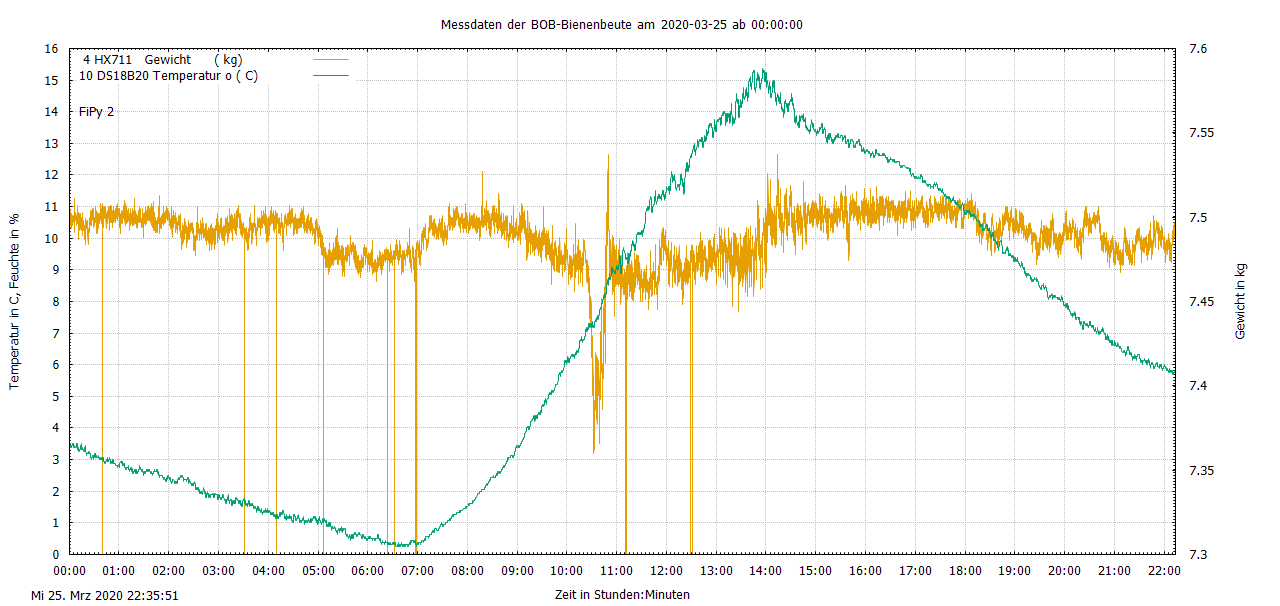
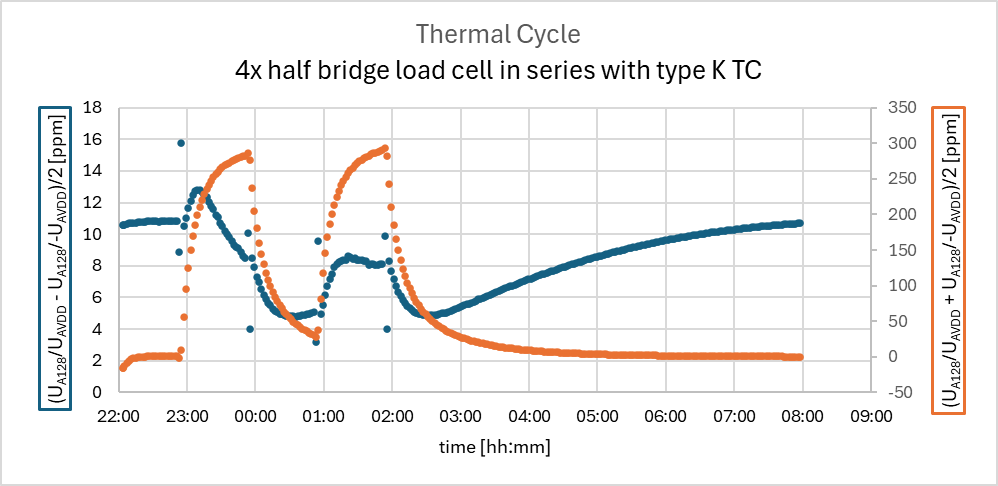
And from these you can derive the Wheatstone-bridge response (blue left y-axis) and the Seebeck-effect (orange right y-axis):
Also these results shows that polarity modulation is able the separation of the 2 composed signals with only a mild response from the Wheatstone-bridge, by the load cells, (10 ppm) on top of a huge Seebeck-effect response, up to 300 ppm. The response of the Wheatstone-bridge/load cells is without mechanical load but shows some thermal drift which is in good agreement with the response recorded without the thermocouple, and seems to be induced by a combination/interaction of thermal- en dehydration-load on the load cells during the thermal cycle.
Resume
With this I think to have shown that:
Comparing both modulation methods
-
Source voltage modulation seems a bit more invasive to the HX711-board and requires effort to determination of the VAVDD-levels by (regular) calibration to exclude VAVDD-drift over time. Furthermore, since the Intercept is quite outside the available 1/VAVDD-range the regression error is quite sensitive to 1/VAVDD-noise or drift.
-
The polarity modulation can be simplified further by flipping the load cell leads connected at the E+ and E- connectors on your HX711, for which you don’t need a signal-relay or reprogramming your Arduino Code. In this way you can check at least if your set-up suffers from Seebeck effect. Note this is not the same as flipping the load cell sense leads attached the A+ an A- connectors at the HX711, as here you will also flip the polarity of the Seebeck-effect and as a result you are not able to separate both signals. If you want to go for an automated set-up, I suggest to use specific signal-relay as they are superior wrt noise.
For both methods the modulation frequency should be fast enough wrt the Seebeck-drift and load variation you like to detect. In the above same a logging-time interval in the order 1 - 2 min is used.
As you can see the voltage (Amplitude or polarity) modulation method is only able to separate electrical signals driven by different sources like Seebeck and electro-chemical, from the Wheatstone-bridge signal, but not thermal influence on the load cell’s strain gauges.
So you need to consider if you want to invest (equipment and time) in the above methods or follow the good design rules to limit the Seebeck effect as also mentioned by Weef:
-
Use as less as possible contacts/extension leads.
-
Use only (extension) leads of same material.
-
Limit the temperature gradient over the leads or at least try to keep the connections at the same temperature, and design the contact-point as close to each other to limit the temperature gradient.
Actually, most likely you won’t be able to exclude Seebeck sources in a circuit containing Load Cells as its strain gauges probably contain Constantan or other exotic metals-alloys (see Strain gauge - Wikipedia) for limiting temperature drift/sensitivity. Fortunately the strain gauges are attached to a metal body (most likely Aluminum) which homogenizes temperature fluctuation and minimizes the resulting Seebeck-effect.
Work in progress
The modulation has shown to be able to filter out one signal-source from a composed response. Since we are only interested on the load contribution in the HX711 ADC response, I would like to introduce load-modulation, to eliminate all response contributions related to any kind of drift. To do so I need to be able successively placing and removing the load, of the object we want to weigh, on the load cell. Given the results above I’m convinced this will substantial reduce all observed load cell drifts like Seebeck and all others. This idea is not new as I think this is also done intuitively by any one using a scale which has a tara-feature. I think this is also, in some way, integrated in professional/industrial scales, which runs in the background.
However, I’ve not jet come to a simple set-up which enables sw-controlled load-modulation. I’m looking for a suitable actuator and a mechanical-design able to lift 100 kg load to meet this application. For sure what will be unattractive is the power consumption of this feature (1 J per lift-cycle of lifting 100 kg 1 mm.) and the question I can’t answer: do the bee’s like to be rocked once in while…
Anny suggestions or help is welcome.