Are the differences notable under outdoor conditions or are the differences minor and will not be notable because of other factors like overall system noise, temperature effects and others?
On CZL601 is an Excitation Voltage 9-12VDC, the LCT start at 5V
I wonder how it would be difficult in an embedded (solar powered) system to obtain this voltage without draining too much the battery.
I’m driving the Bosche H30 and H40 - datasheet says also 5-12 V - with 3.3 V and it works good. What I see, at least with the Bosche cells, a separate voltage rail for the excitation seems not necessary.
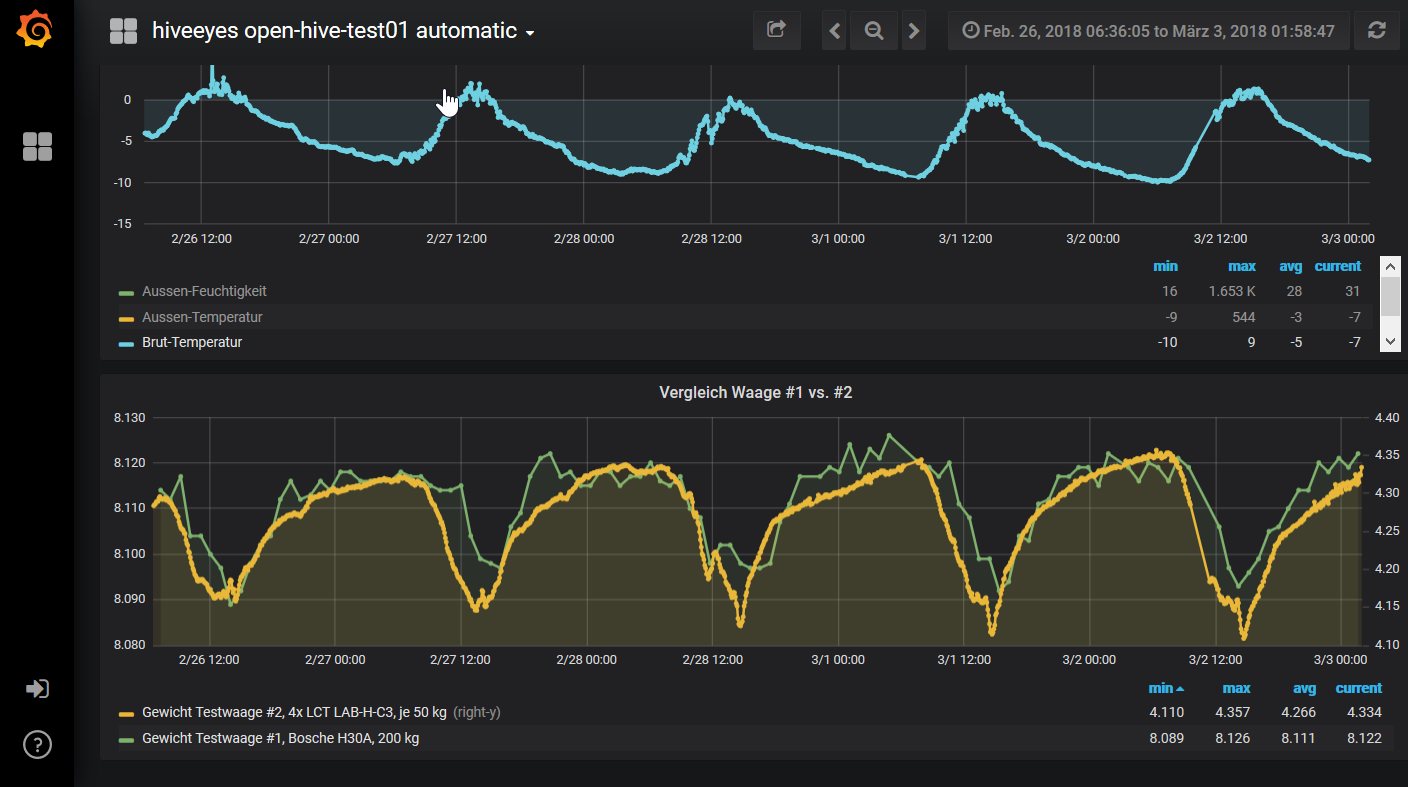
Hier ein Vergleich einer Bosche H30A, 200 kg und 4x LCT LAB-H-C3. Die H30 ist für eine “Halbe Messung” vorbereitet, d.h. wenn ich auf die Waage 1 kg stelle wird 2 kg angezeigt.
In den knapp 5 Tagen schwankt die LAB (gelbe Linie, rechte y-Achse) um ca. 250 g, die H30A (grüne LInie, linke y-Achse) um ca. 35 g (real 35g/2), durch die Verdoppelung in der Software sind es eigentlich nicht mal 20 g!
Nun muss man nochmals genauer schauen, woran es liegt. diese große Differenz hätte ich so nicht erwartet. Jetzt muss man schauen wie linear sich die Temperatur- und Gewichtswerte verhalten, und ob eine Korrektur auf Grund der Temperatur den Fehler ausbessern kann. Bei der H30A würde ich mir den Zauber sparen.
Hi @clemens. Habe deine Mail gelesen. Sieht nicht so toll aus. Hast du auch werte für die andere “schlechtere” LAB-H-B Zelle? die LAB-H-C3 sollte je eigentlich stabiler sein was temperaturschwankungen angeht.
Scheint sich mal wieder zu bestätigen dass was wenig kostet auch wenig tauglich ist.
Die anderen Zellen sind noch bei mir im Keller. Zwar schon montiert, aber noch nicht mit einer Platine für den Zusammenschluss der vier Zellen. Die Daten in der Tabelle sind komisch. Manche besser für die teurere Zelle, manche schlechter - müssen wir selbst wohl nochmal nachmessen.
Ich hatte ja die aus Streifenplatine selbst gelötete “junction box” im Verdacht und u.a. daher ein kleine Platine designed. Leider sind die Gewichtsschwankungen bei konstantem Gewicht mit der neuen Platine ähnlich hoch bei den “China-Zellen” wie schon im Frühjahr 2018 verglichen mit den Schwankungen der Bosche-Wägezelle:
daher werde ich aus unseren gemessenen Abweichungen nicht so ganz schlau … :-/
Was mir beim Datenblatt gerade auch noch aufgefallen ist:
Excitation, recommended 5-12V
Das machen wir nicht, sondern betreiben das System mit 3,3 V, ebenso die Bosche-Zelle, da ist es allerdings nur eine und nicht 4! Könnte das ein Grund sein?
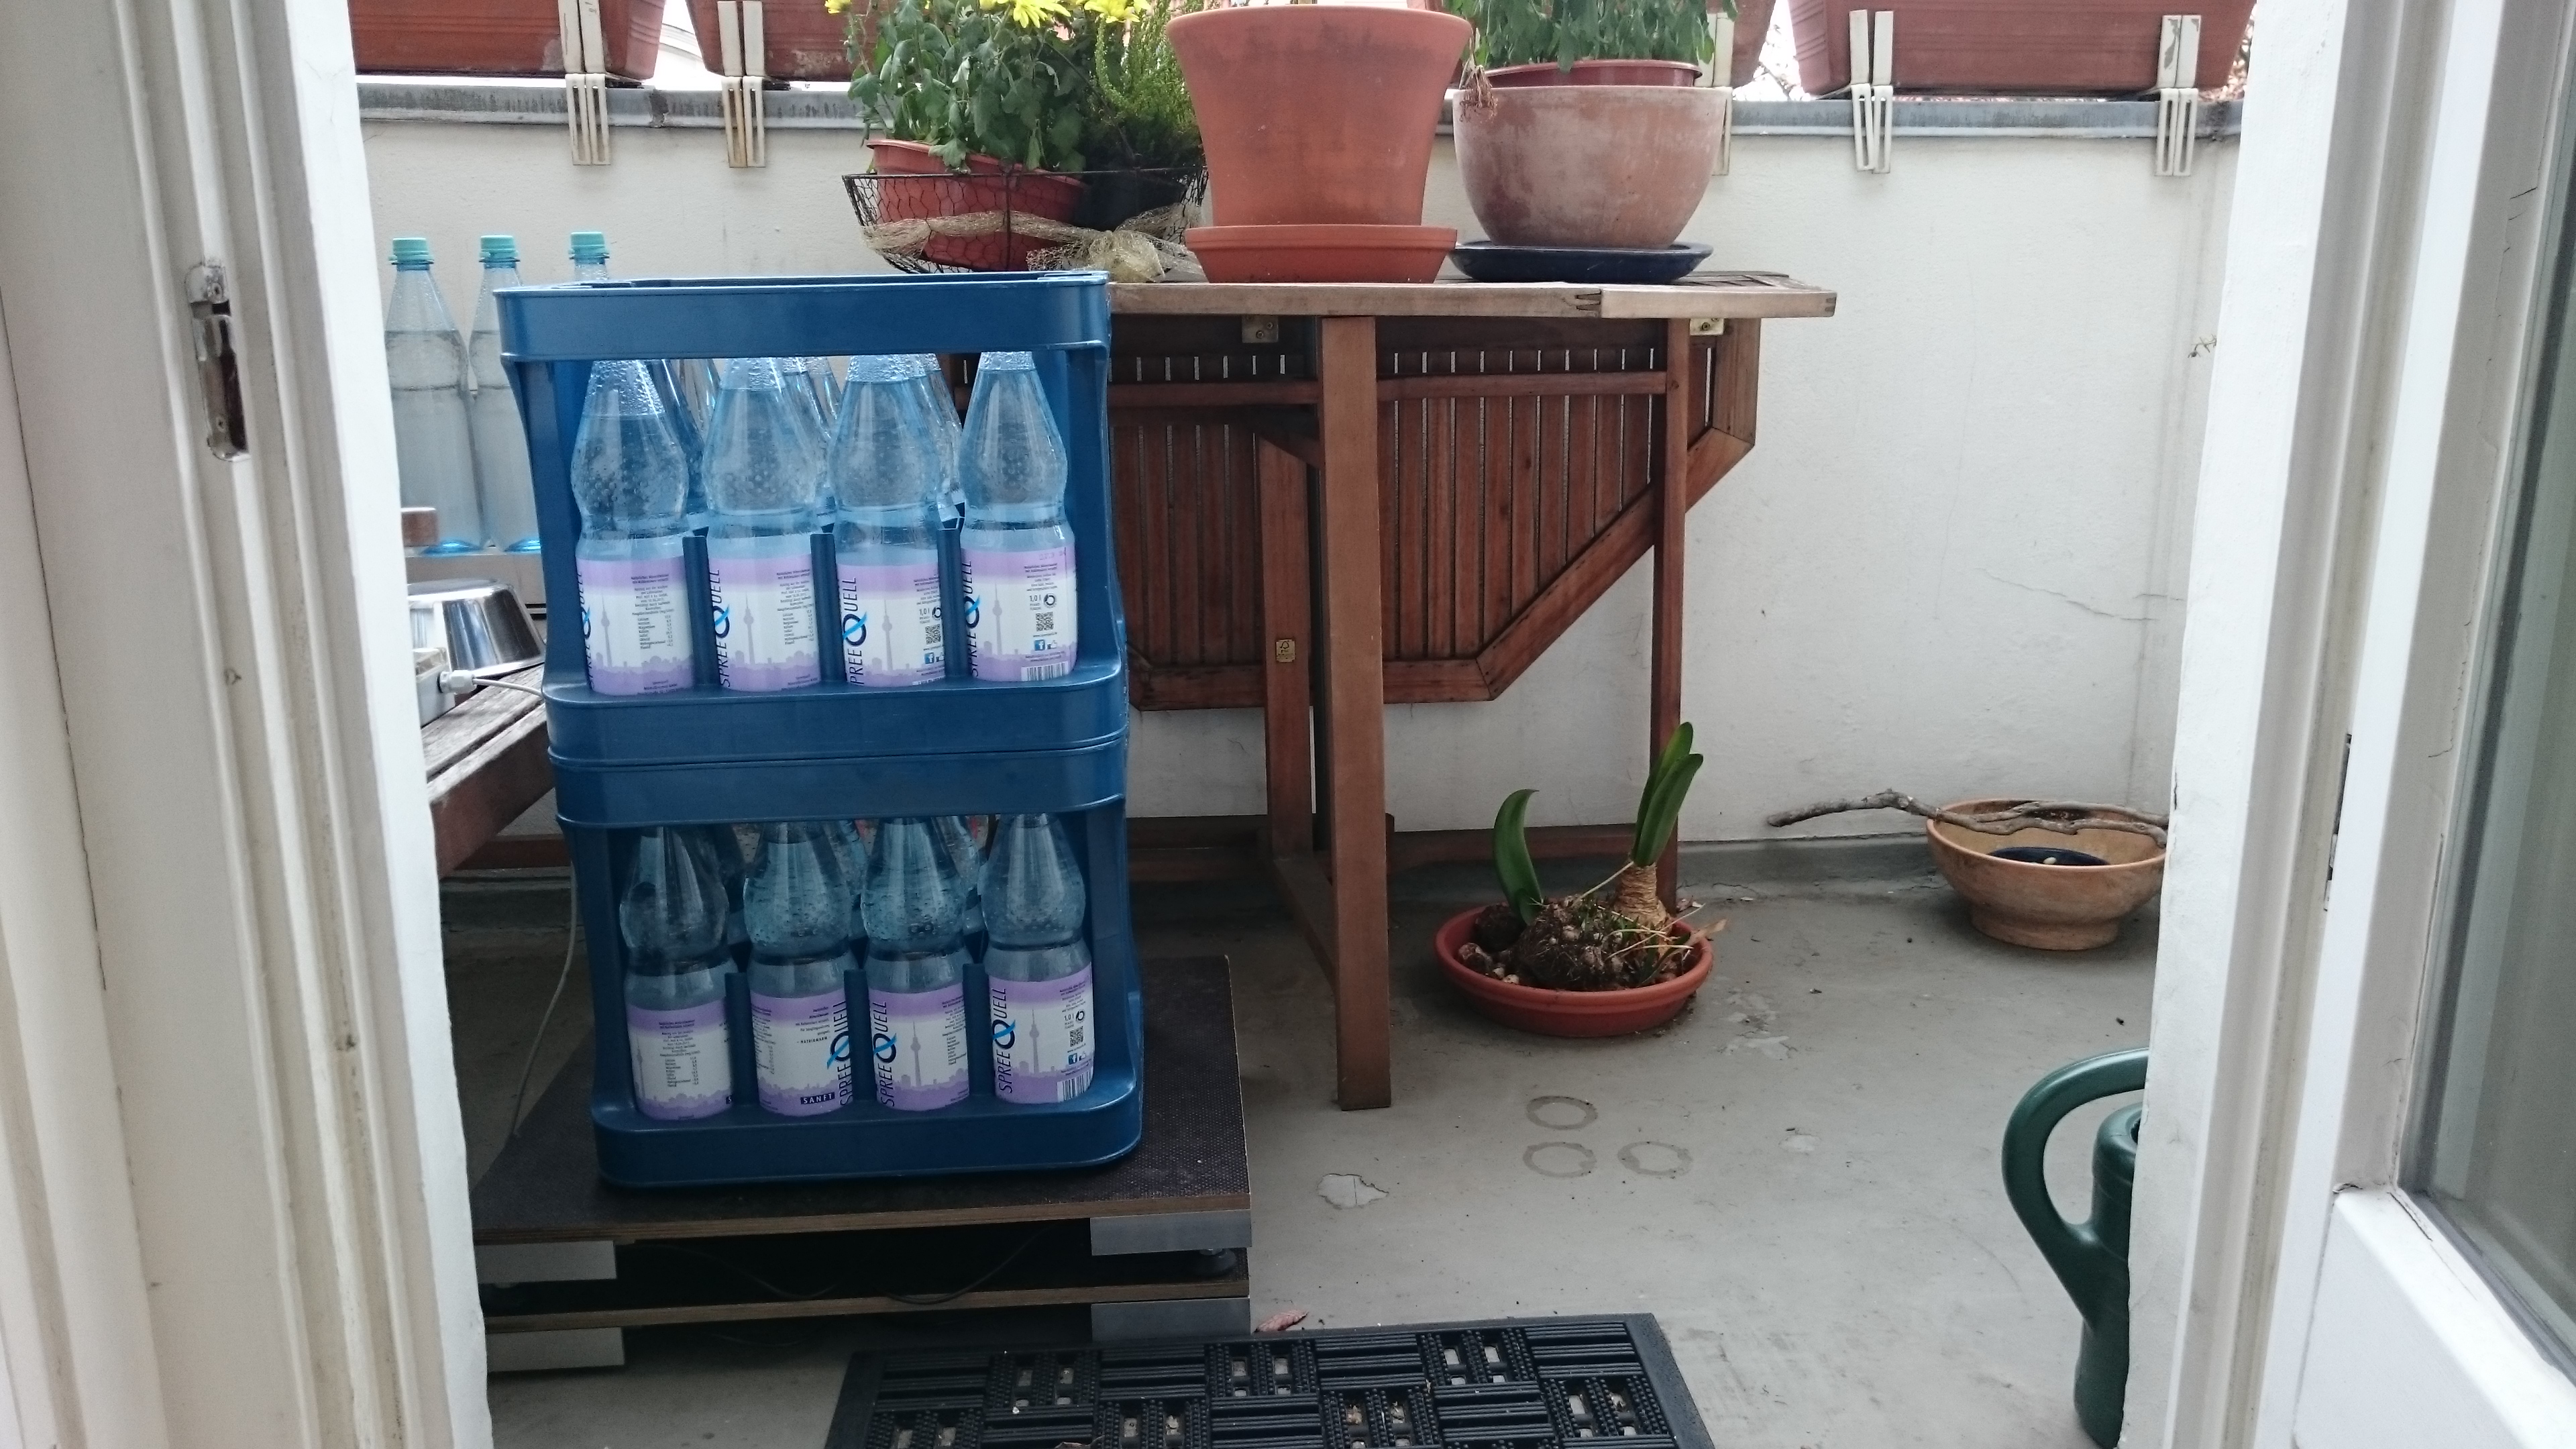
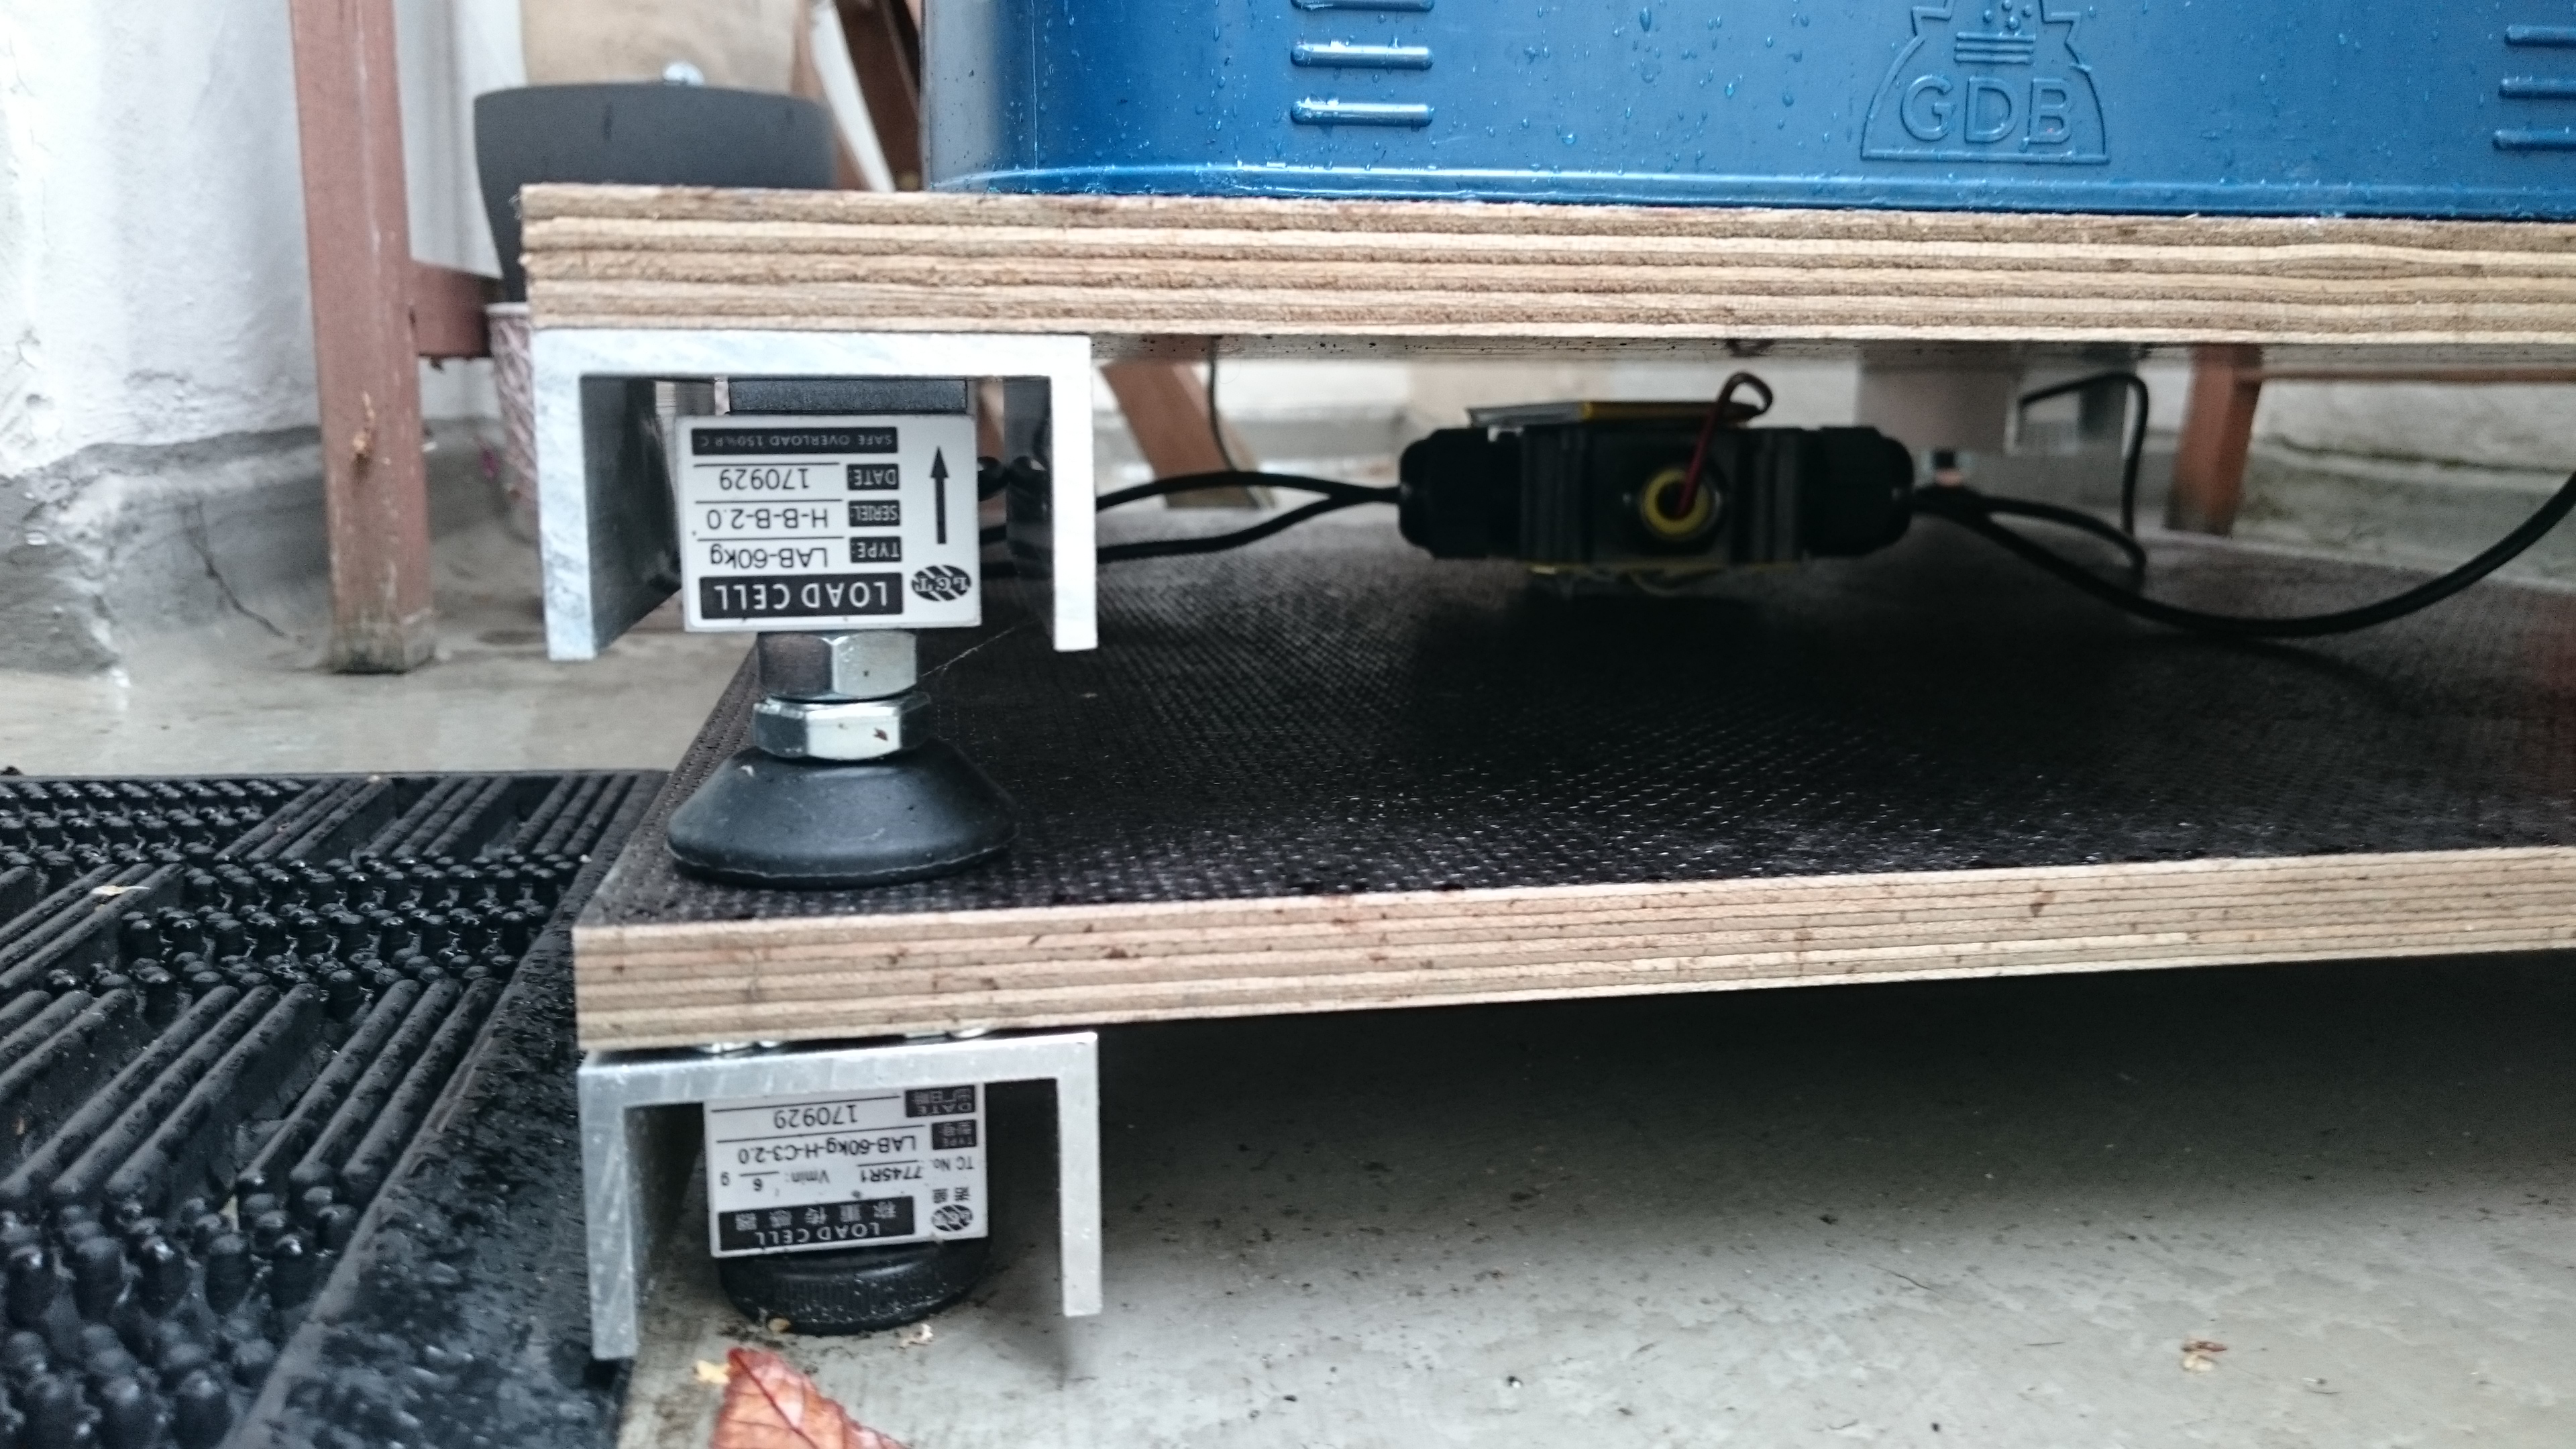
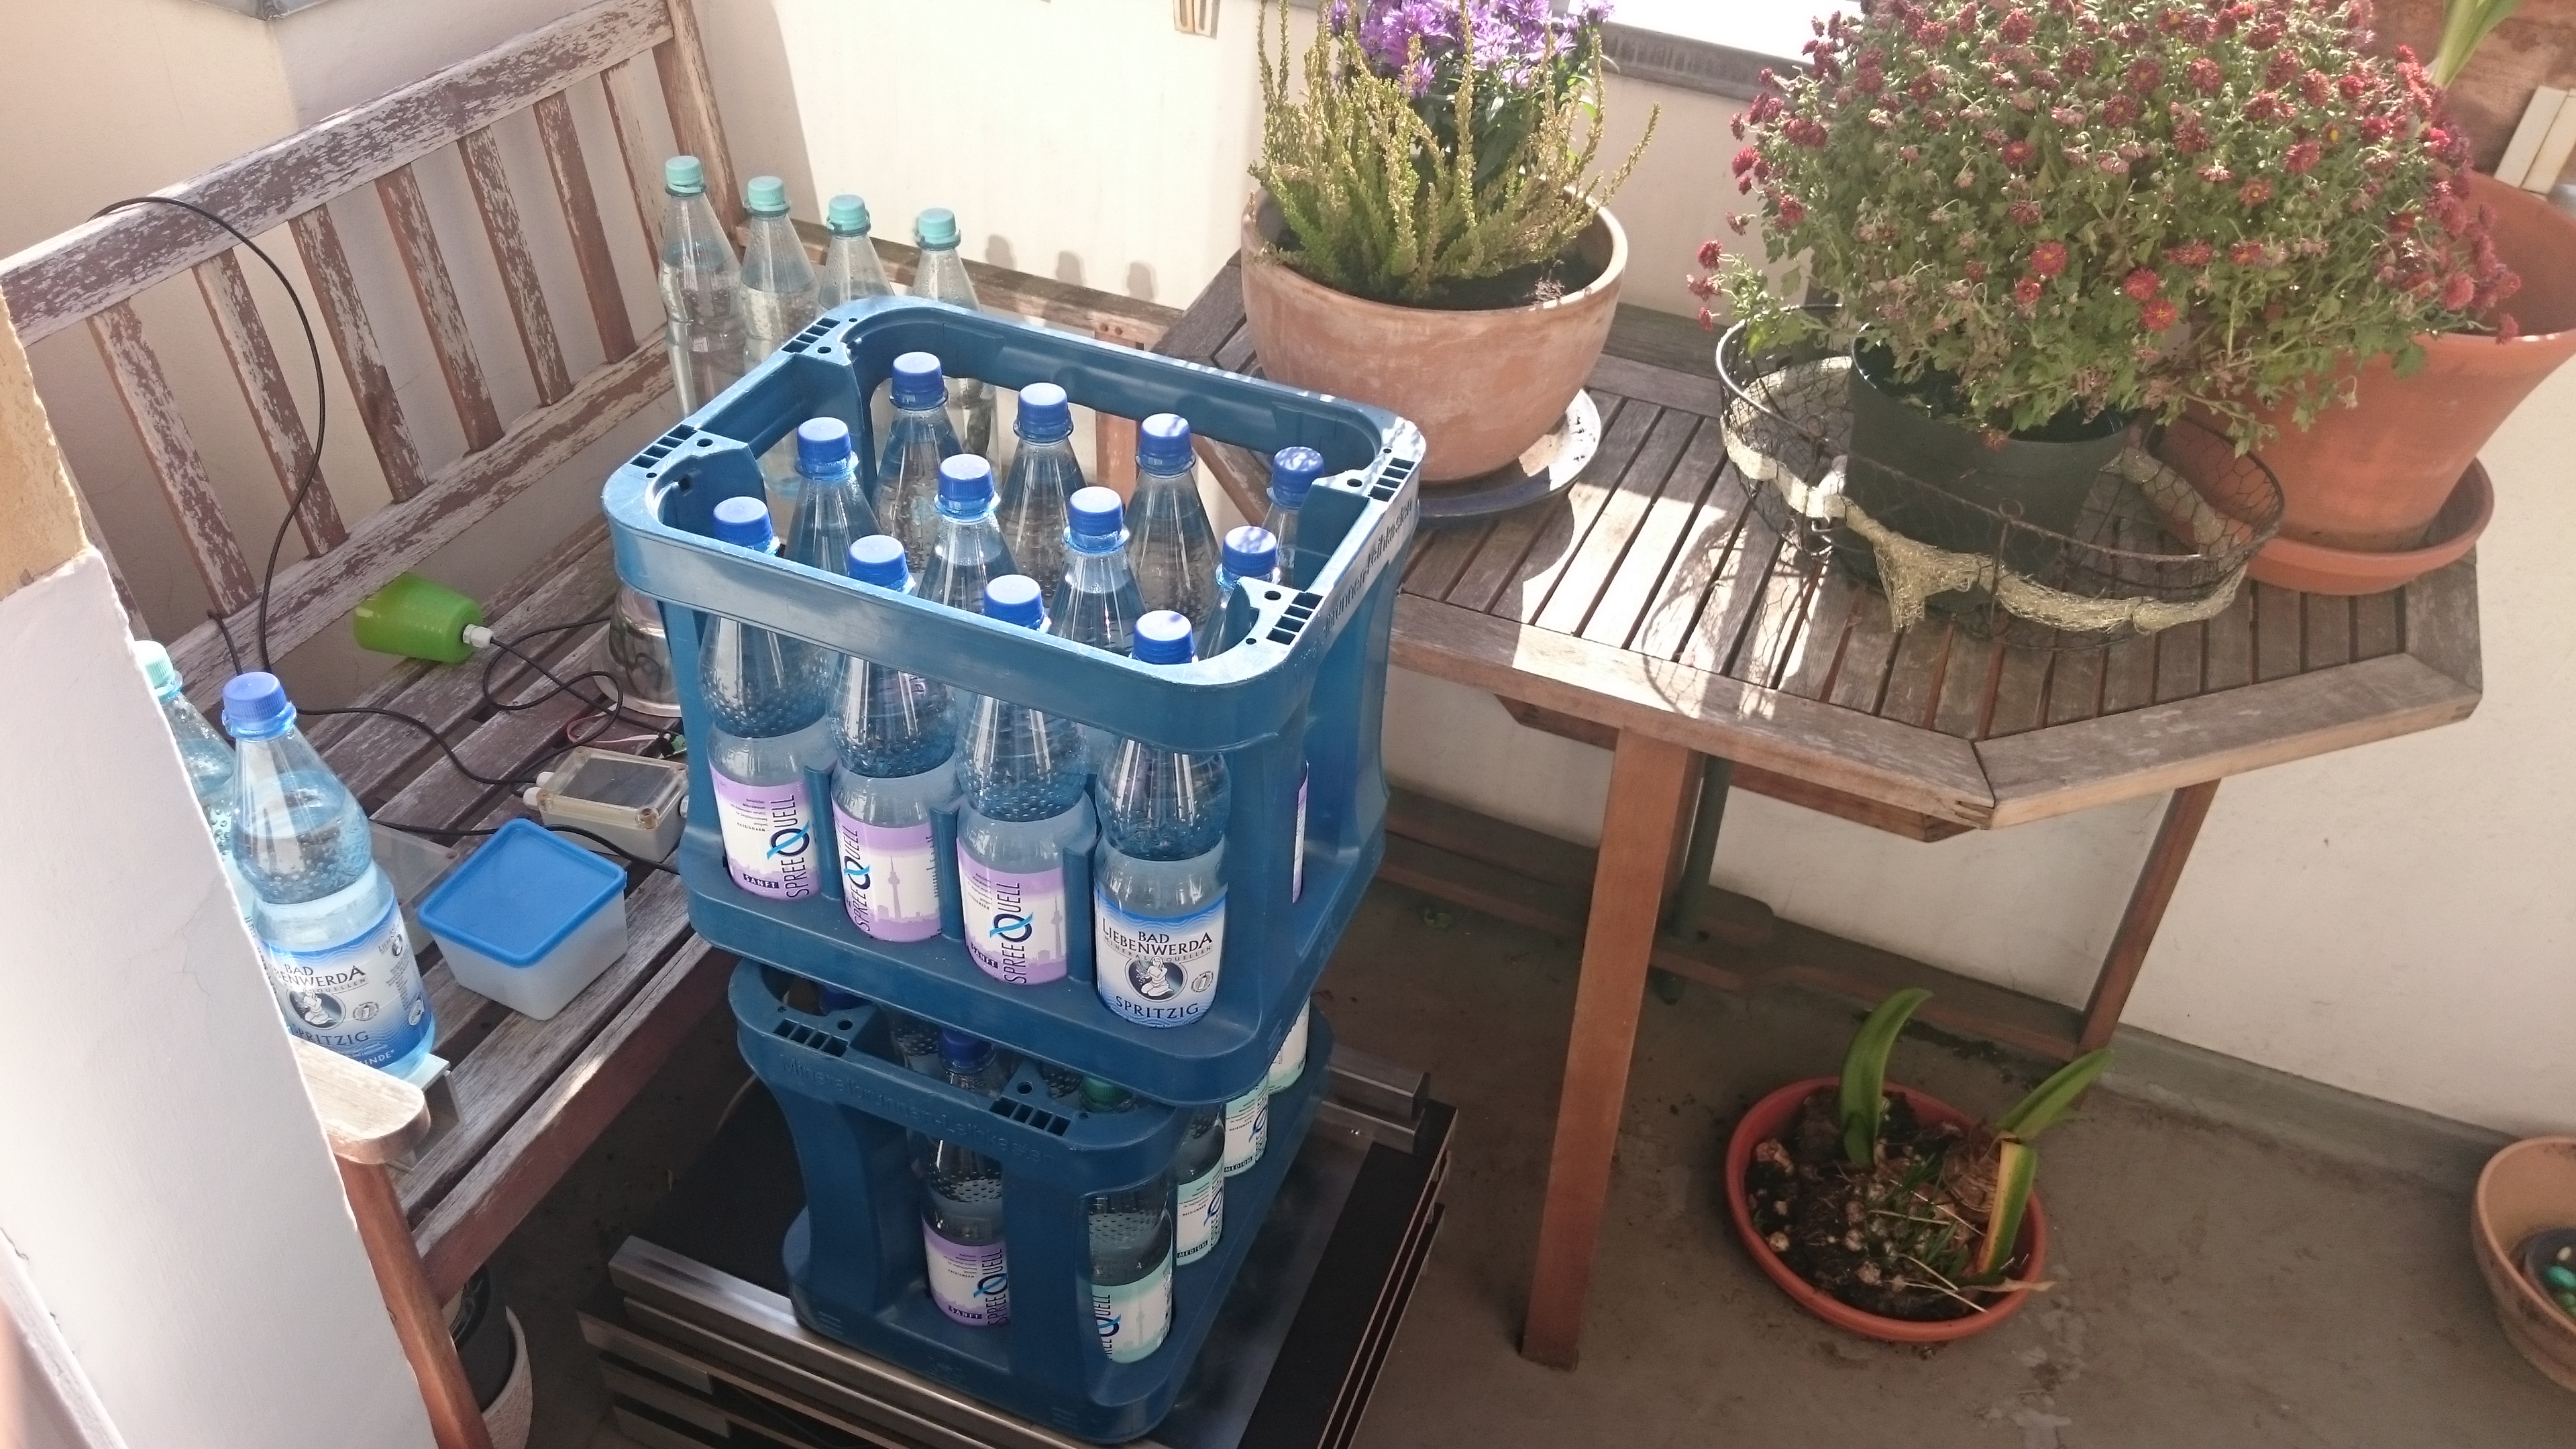
Damit teste ich nun die “teurere” LCT LAB-H-C3 und die “günstige” LCT LAB-H-B in einem 4er-setup (parallel geschaltet wie schon oben) nun mit ca. 30 kg Gewicht.
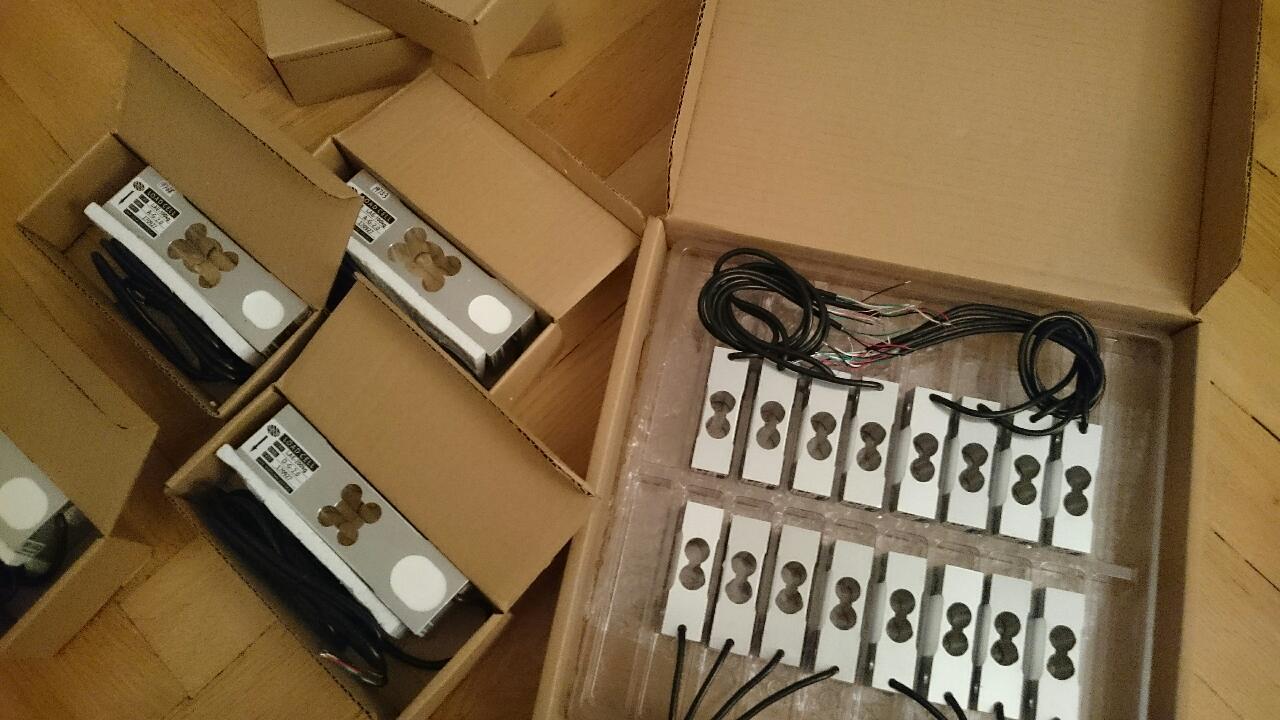
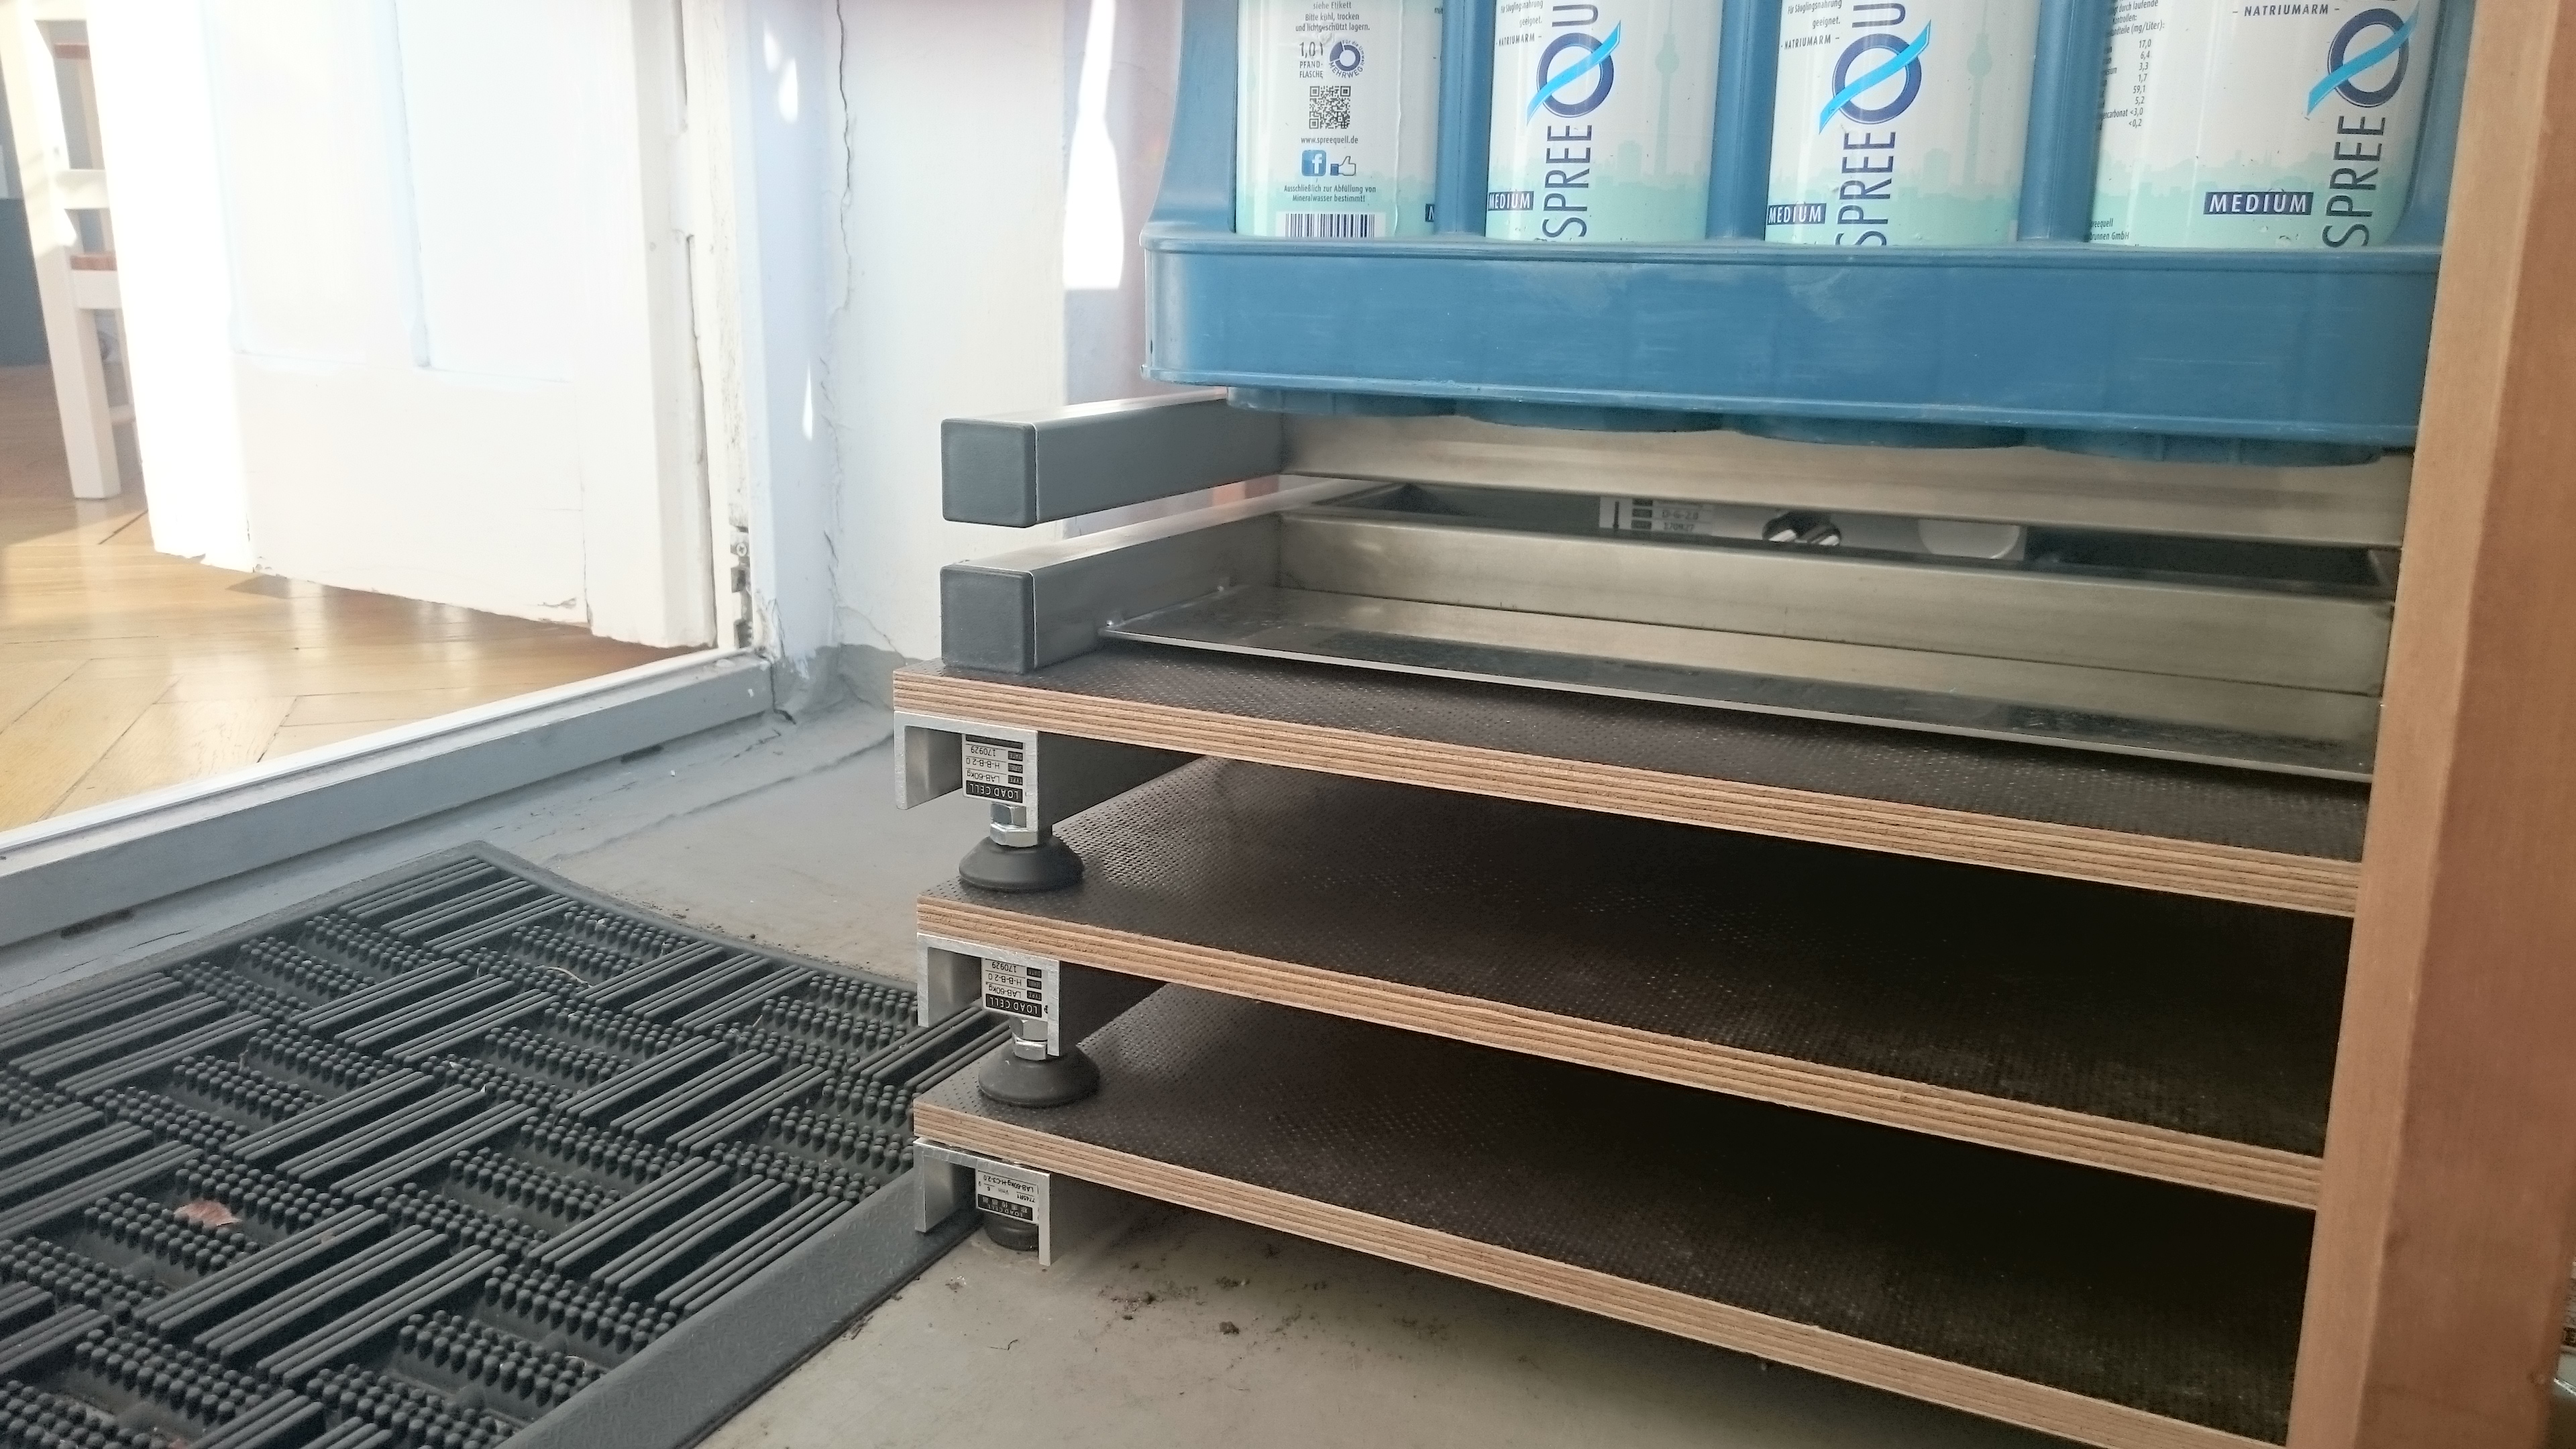
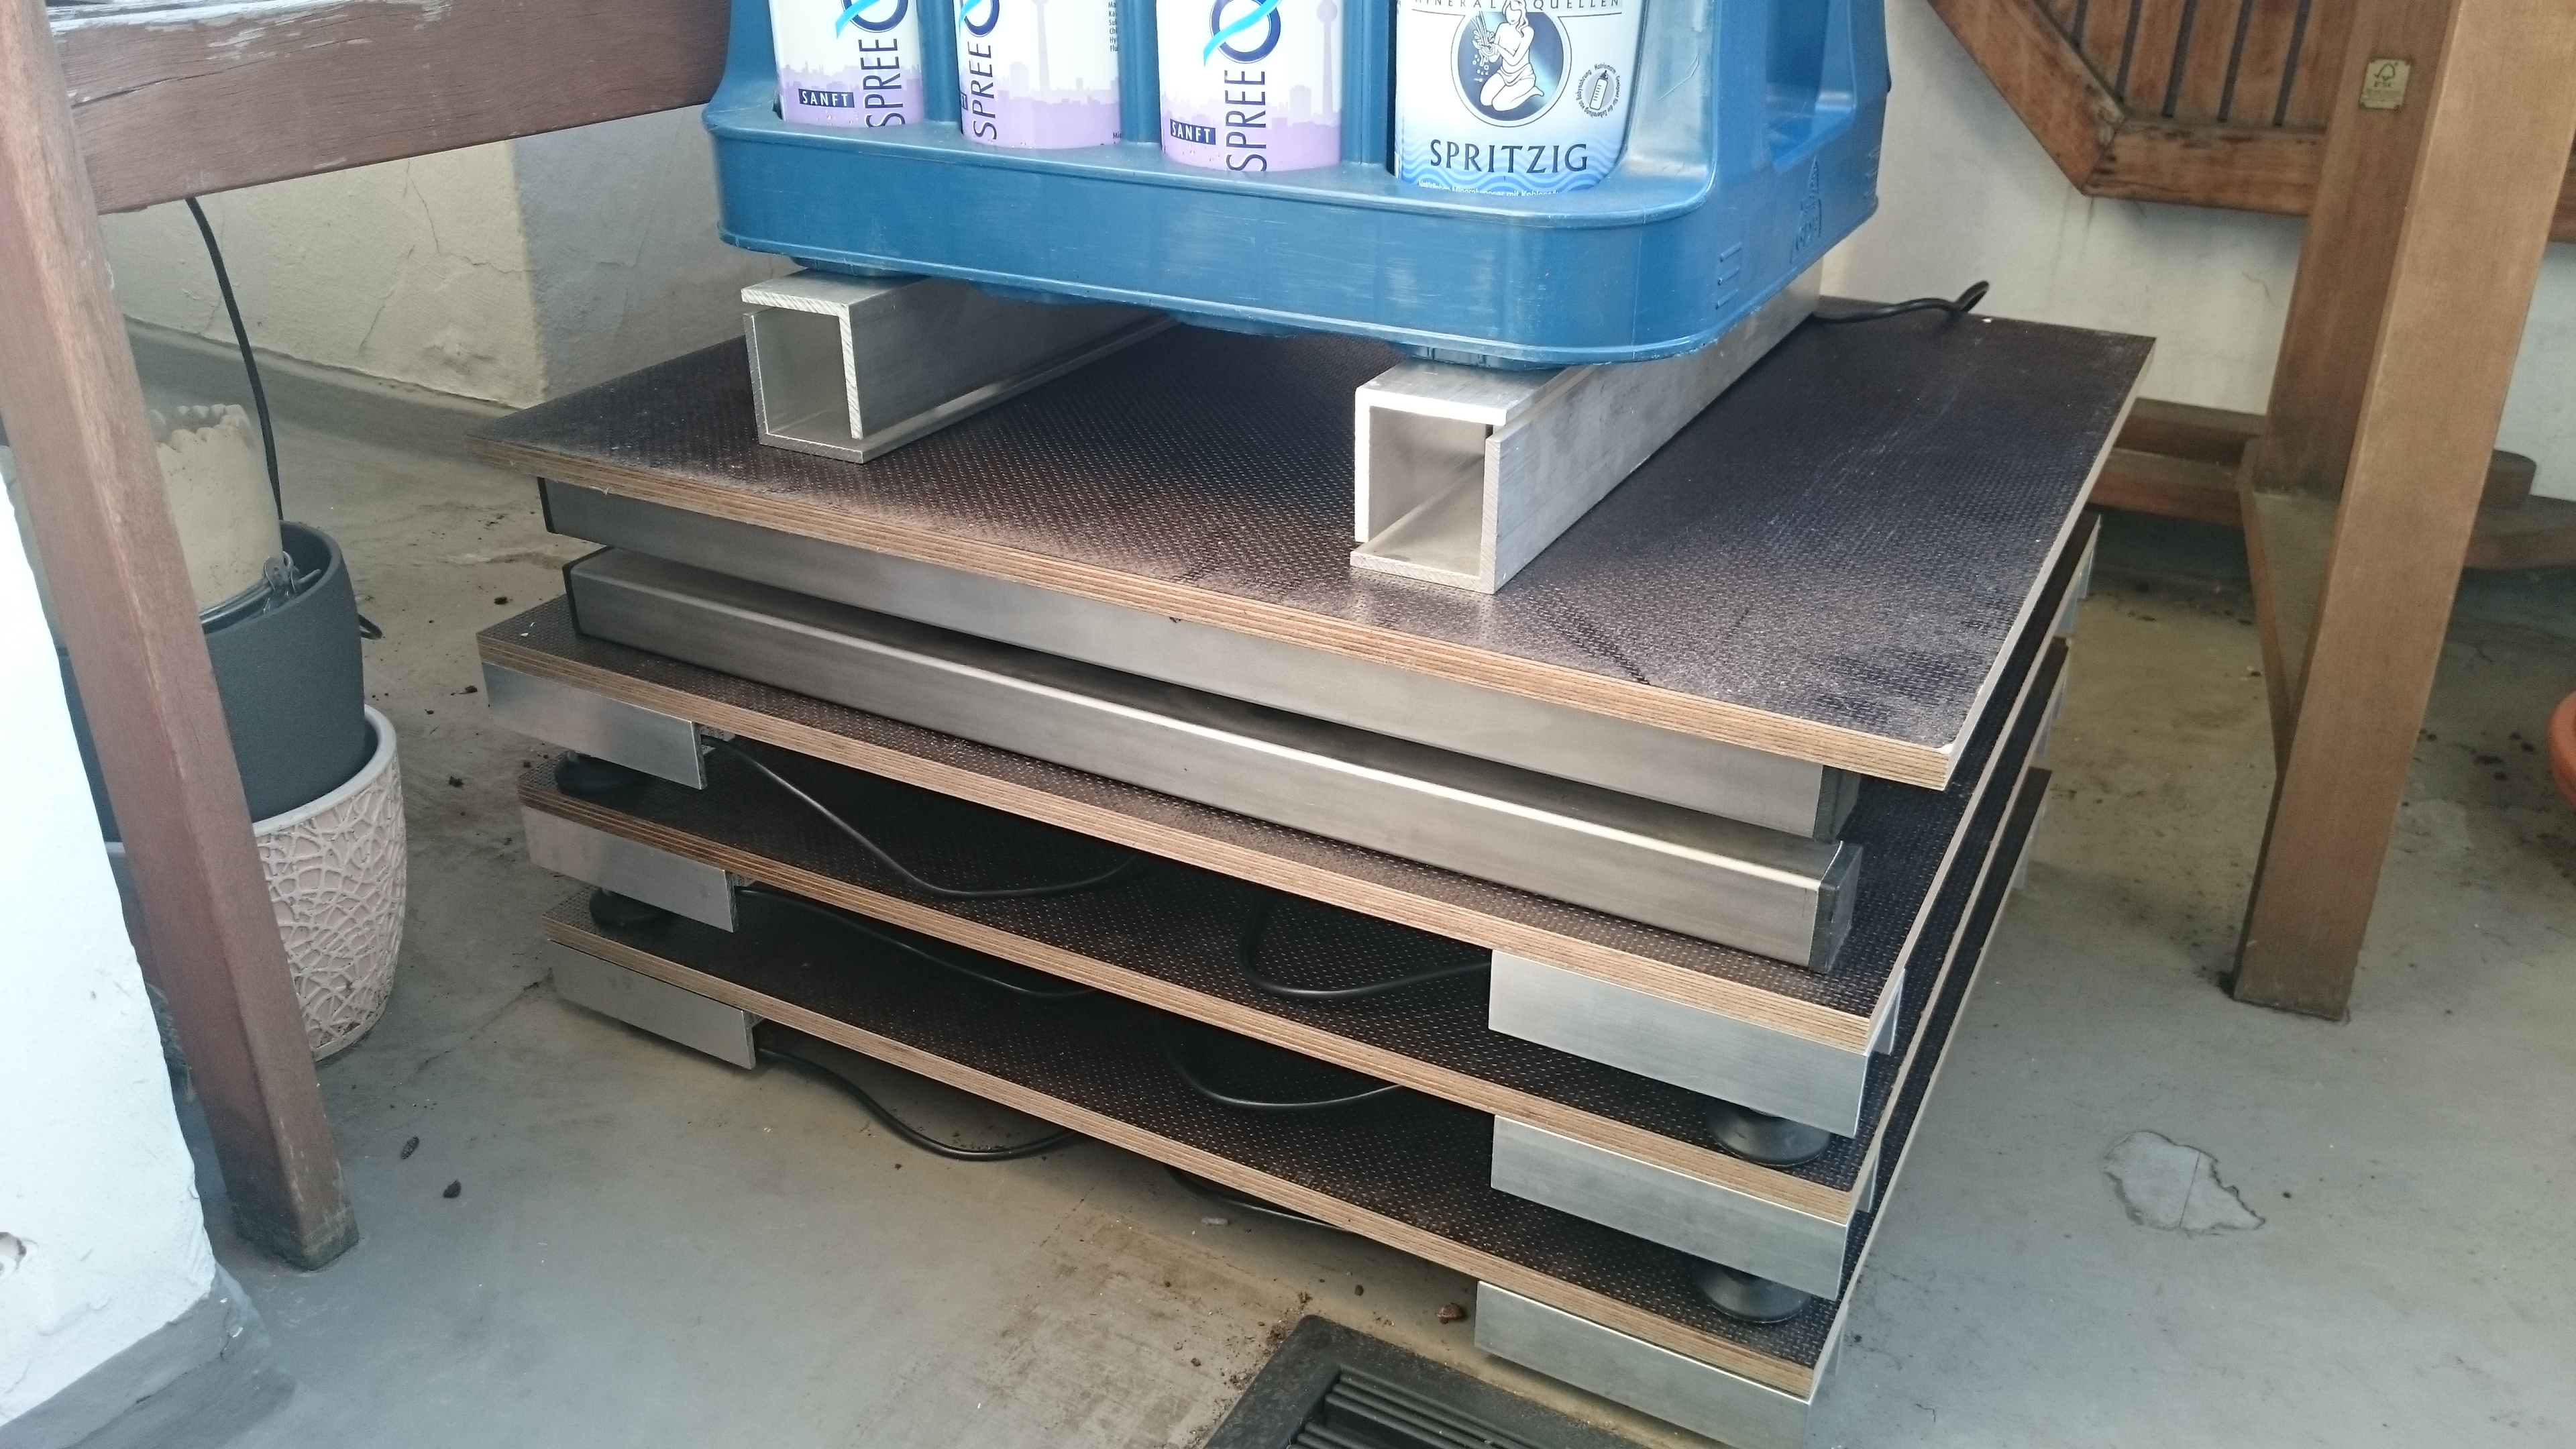
I have changed the 4 LCT LAB-H-C3 load cells and have replaced the above used with an other “4-pair” of LCT LAB-H-C3 load cells to be sure to have not just a buggy “pair”. you can see the new load cells as lowermost layer in the last post’s picture. It is scale #2 / Waage 2.
I added a second scale layer with “cheaper” LCT LAB-H-B load cells as scale #3 / Waage 3.
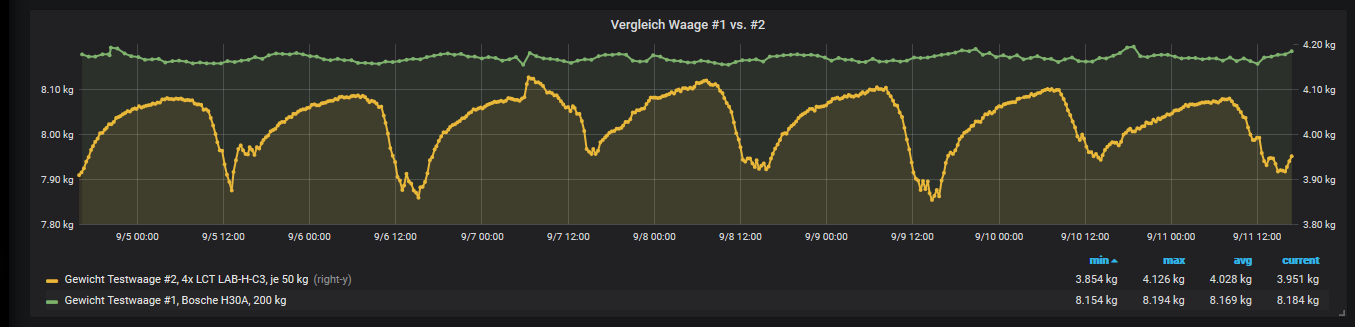
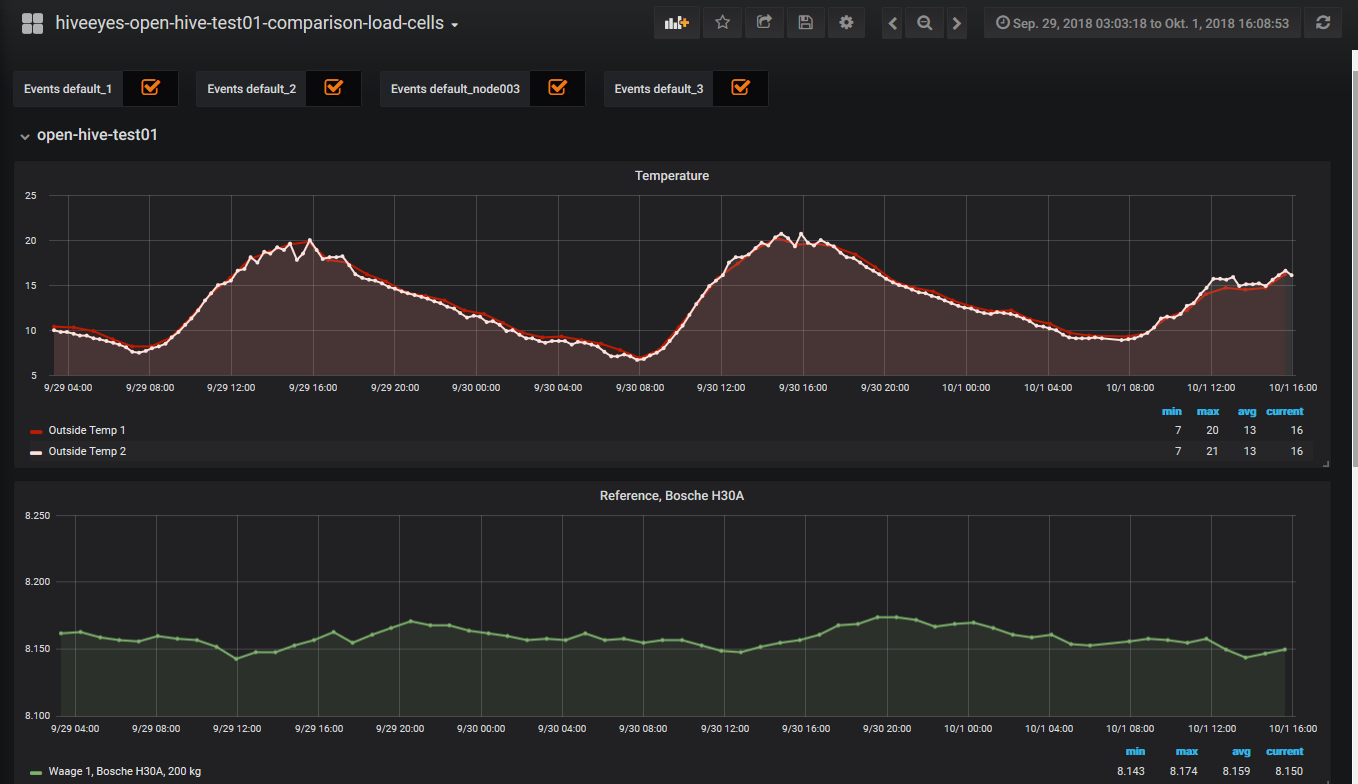
You can see in the first chart the temperature changes over the test perode. It differs from about 7 °C to 21 °C, so we have a range of around 14 °C.
The reference load cell Bosche H30 has still only 30 g difference in the test period. And we double the “real reading” because we are using the scale as “half side scale”. So the real oscillation is 15 g only! (2nd graph in the picture).
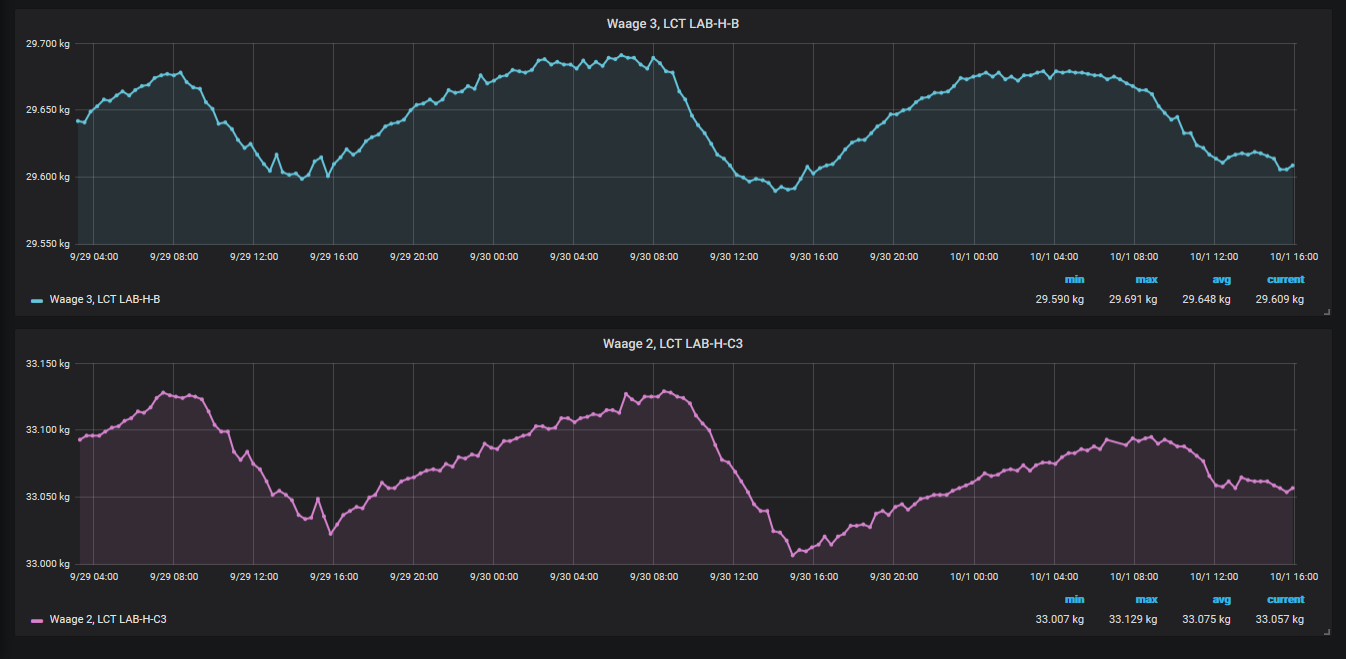
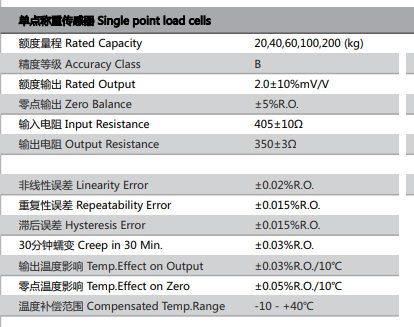
Now let’s have a look at the LCT cells: The “cheap” LAB-H-B has a measuring span of 100 g (Waage 3) while the more expensive LAB-H-C3 oscilates with around 120 g (Waage 2)!
This is less than the first resultsl of 200 g or 250 g with the other 4-pair of the LAB-H-C3 but still a lot compared to the Bosche load cell.
Let’ have a look at the LAB-H-C3’s data sheet:
Temp.Effect on Output -10°C~+20°C %R.O./10°C ±0.0117
… and the LAB-H-B
Temp.Effect on Output ±0.03% R.O./10℃
Temp.Effect on Zero ±0.05% R.O./10℃
I assume that this is the percentage of the maximal load, so it is 60 kg x 4 = 240 kg. Btw. What is the difference between “on Zero” and “on Output” here?
±0.0117 percent of 240 kg is 28 g x2 (because of the ±) 56 g
±0.03 percent of 240 kg is 72 g x2 = 144 g
for “Zero” ±0.05 percent of 240 kg is 120 g x2 = 240 g
We had a bit more than 10 °C so the values for the cheap load cell seems ok in case I did not misinterprete some values in the datasheet. Perhaps someone else can doublecheck this.
But why can I read in the same datasheet >Temperature Compensated -10to+40 ??
The question to myself is now: Should I search for other but more robust cheap load cells or should I use this one and try to compensate the differences by software.
Hey Clemens!
after a first dive into “load cell science” I would agree with your estimations.
I calculated an error of ~200g with dT=14°C for the LAB-H-B with 240kg maximum load (“on Output”).
I guess “on Zero” means with no (or at least almost no) load applied and “on Output” with maximum load applied. So the error would become less with higher load applied.
temperature compensated means only that they try to minimize the error and know how much it is for that temperature range:
see this link
I also tried to calculate the temperature error of the ADC. The datasheet of the Hx711 states ±6nV/°C. If we work with a 3,3V we get:
6 nV/6,6mV * 60 000 g = 0,05g /°C
so less than 1g for 14°C…
We could define a maximum error for the scale system to be able to decide if we can use these cheap load cells or not. And we could try to compensate the error with the software and see how well it works over time.
so… What would be the maximum temperature-dependent error of a hivescale a beekeeper and/or data analyst would be ok with?
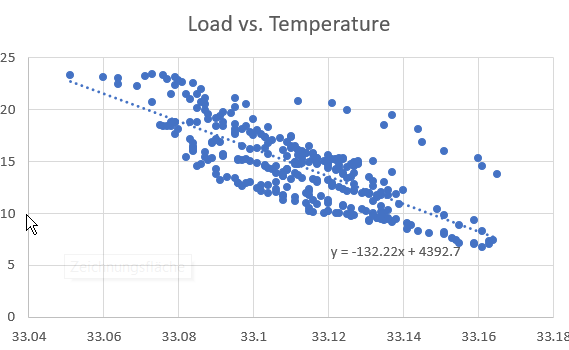
I have plotted the data from Test01, Node2 duration: October, 6th to 10th in a x-y-diagram. There was some rain before but not in this periode and we have here the 4x load cells LCT LAB-H-C3:
You can see a very nice dependancy between temperature and weight. So we can adjust the “real” weight by excluding the effect of the temperature. You see a lower weight value with high temperatures and more kg on colder times.
Let’s take a temperature range of 10 °C we have from 10 °C to 20 °C a range of 33.15 kg - 33.07 kg = 0.08 kg for 10 °C or 0.008 kg for 1 °C!
Our calculation for the real weight is:
measured weight + (measured temperature - 16 (temp I adjusted the scale)) * 0.008
or in Grafana:
SELECT mean("Gewicht") + (mean("Aussen-Temperatur")-16) * 0.008 FROM "default_2_sensors" WHERE $timeFilter GROUP BY time($__interval) fill(null)
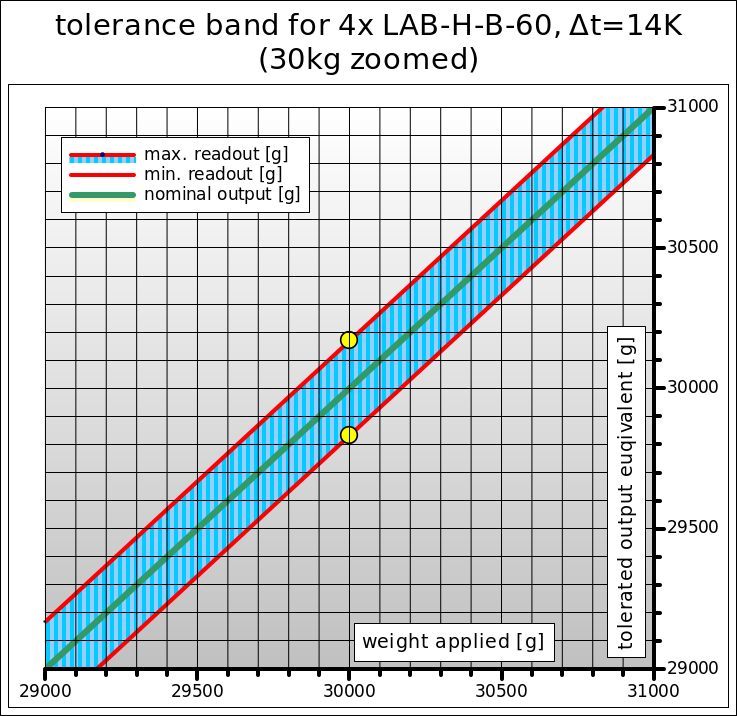
is the rated output aka sensitivity , the voltage seen per Volt excitation voltage when loaded with rated load or rated capacity (aka beeing @100% of the transducer load, or @fullscale (FS)). - The LBM-H-B-60 has specs for “%R.O.”, this reads as “%FS”.
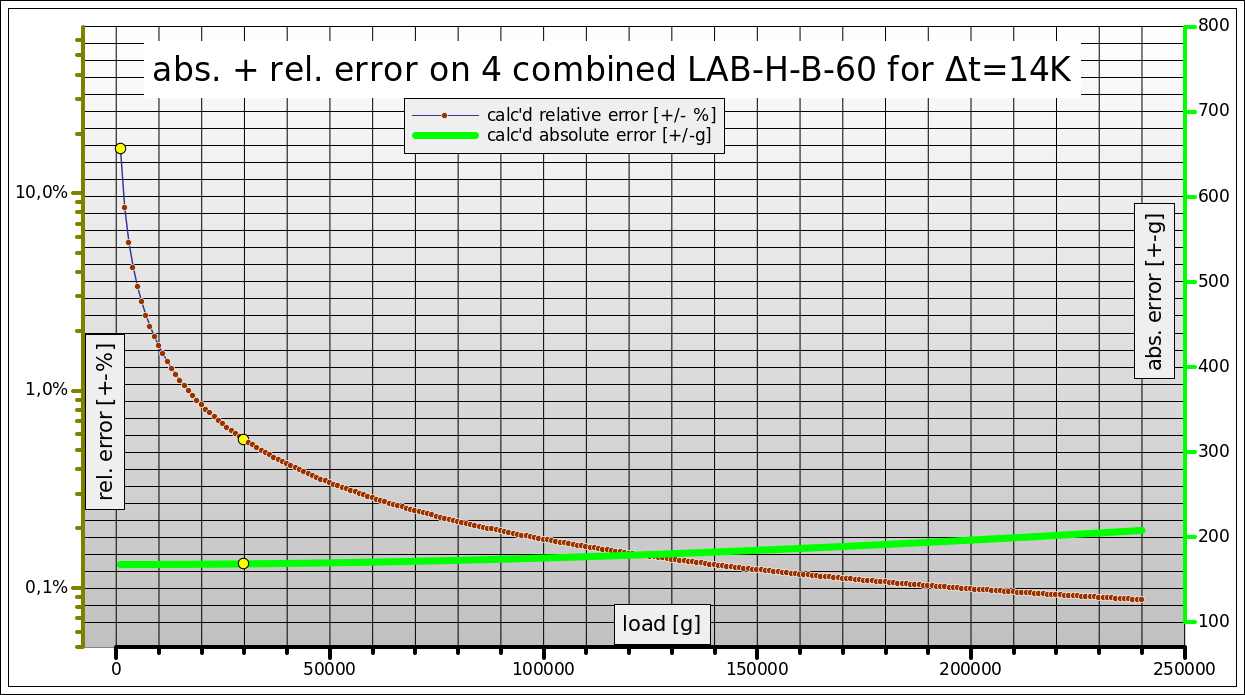
I can second that: at rated load within 14K temp range, this scale has a ±0,0867% rel. error, which is 208,0g bigger or smaller than the real value (239,792kg… 240,208kg).
For @clemens’ close-to-30kg load (didn’t find weights for this brand of water bottles, but I think you are closer to 29kg than 30) within again 14K, you’ll get at least a ±0,5623% error @30kg. They are ±168,7g and result in measurement readings from 29,831kg to 30,169kg for nom. 30kg. - Your results fit well within the performance specified in the datasheet (given that the nominal load is only something 29,…kg! ;) ).
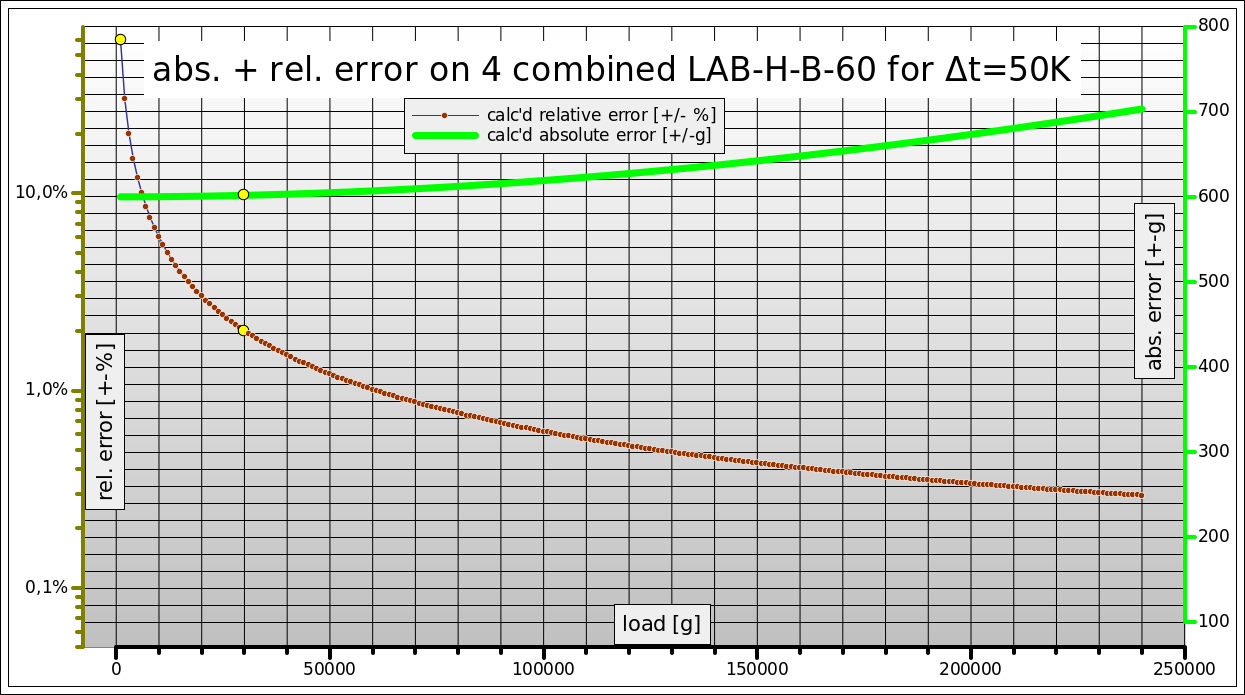
For the full specified temperature range (-10…40°C) of this load cell combination, results for 30kg are as follows: +/-2,0058% error, +/-601,7g half absolute error (29,398kg…30,602kg).
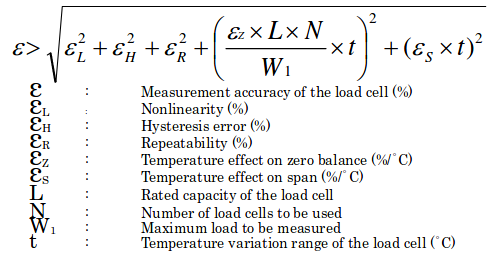
The formula used (see below) is a statistical error distribution for combined uncertainties, not a worst case scenario, when errors add up into one direction. This lets space for even bigger errors! ;)
By the way: for any given temperature (no range) and 30kg load, the 4xLAB-H-B-60 scale discussed here has only +/-0,0496% or +/-14,9g uncertainty! This holds a great potential for future improvements.
True. In this range they ensure usablility of their accuracy/error coefficients in the data sheet to get a predictable error.
Yes, again fullscale. - This seems to be a typical ‘lost in translation’ error in the datasheet, as the word Rated is simply beeing missing, and no one with language and tech knowledge reviewed this datasheet… ;(
This especially gets weird, as some measurement equipment has errors specified in “% of reading” (%RD). This visually might look like “% R.O.” for a translator… And then there is also “O.R.” which can be “% of range” or “% of rate”.
But from the values seen, I agree gained an educated hope that their specs refer to “% of rated output” .
… but only the relative error. That’s why better matching of the rated scale load to the hive’s weight range helps! :) .
Using this (when not having a combined error in datasheet):
L and N stand side by side as factors, this makes no difference between a (theoretical) 1x 240kg LAB-H-B and a combination of 4x LAB-H-B-60 (of course, this neglects any errors introduced by just connecting them in parallel - but this formula makes only the best assumptions on how a cell number N > 1 is combined).
Bei über 300 Messungen dieses Zeitraums wurden 88 verschiedene Temperaturen gemessen sowie 131 verschiedene Wägewerte. Es gibt also mehr Wertepaare Gewicht/Temperatur, bei denen identische Temperaturen mit mehr verschiedenen Gewichten verpaart sind, - als umgekehrt: mehr verschiedene Wägewerte treffen eher auf gleiche Temperaturwerte.
Dadurch, daß Du die Achsen drehst, damit faktisch Ursache und Wirkung, hast Du viele verschiedene Gewichte, die die gleiche Temperatur “erzeugen” (in Wahrheit: während gleicher Temperaturen aus dem Waagensensor kamen), erhälst Du eine stärkere Kopplung, als tasächlich vorhanden, deshalb kommt der slope von 0,0075 zustande. Deine Korrekturfunktion verstärkt daher zu sehr den Temperatur-Einfluß, das sind z.B. die kleinen Überschwinger zur Tagesmitte.
Dadurch, daß Du die Achsen vertauschst, erkennt man auch keinen Zusammenhang der Koeffizienten zu der Regression in Graph: 1/132.22 ist 0,0075, Du hattest per Ablesen die 8g/°C vorher bestimmt…
Wenn also y=Gewicht und x=Temperatur ist, dann hat man m schnell per Graph oder mit =SLOPE(y-range, x-range), bei Deiner Tabelle =SLOPE($B$2:$B$314,$C$2:$C$314)
Die Korrekturfunktion benötigt also diesen Anstieg mit umgekehrtem Vorzeichen (0,004467). Das sind die von Dir erwähnten gut vier Gramm.
Stellt sich noch die Frage nach dem offset n . Da wir die Temperatur beim Nullen nicht kennen, fehlt uns hier ein wichtiges Wertepärchen, mittels welchem wir die Lage des Graphen im offset fixieren könnten. So bin ich halt vereinfachend davon ausgegangen, daß die Hälfte der Werte zu groß und die andere zu klein waren, und verschiebe alles um die Hälfte der gemessenen Toleranz (hier 57g), dann errechnet die Regression einen offset von 69g (0,06943).
Das kommt in Grafana: SELECT mean("Gewicht") + (0.00446763*(mean("Aussen-Temperatur"))-0.0694) FROM...
Ich hab das in Dein Panel eingefügt, wenn Du sie nicht gleich entdeckst, dann ist das nicht verwunderlich! ;)