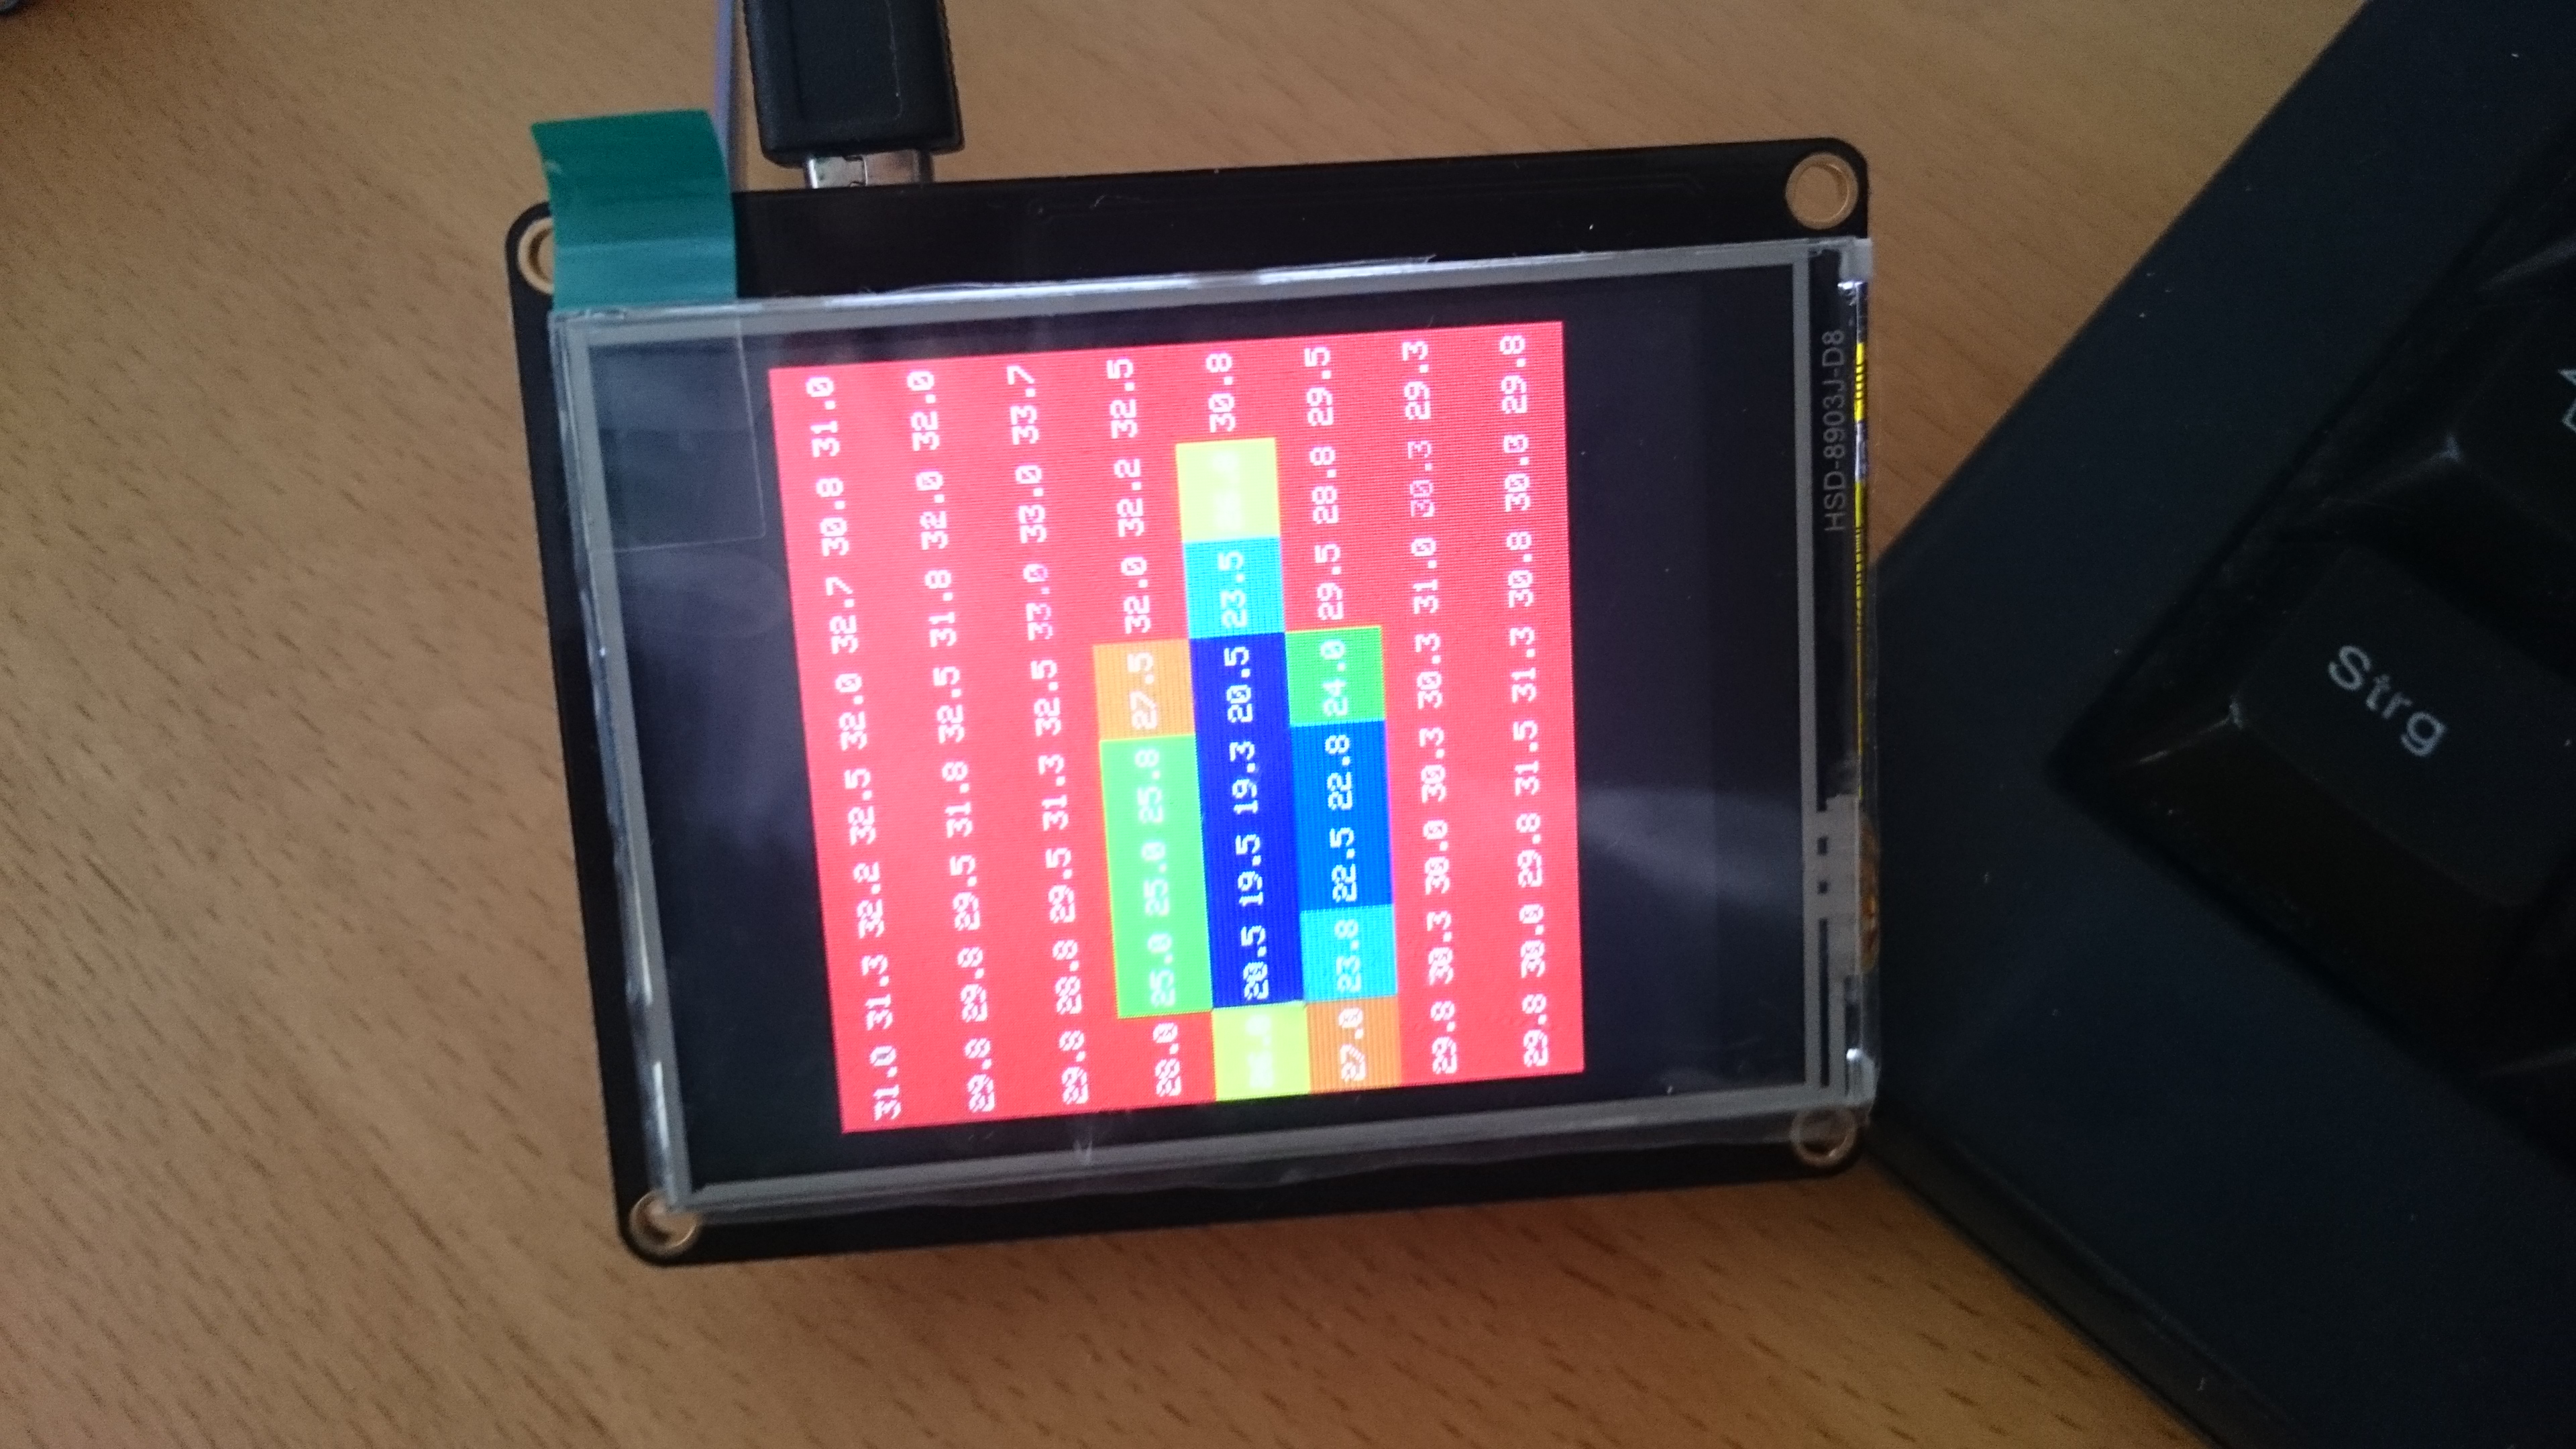
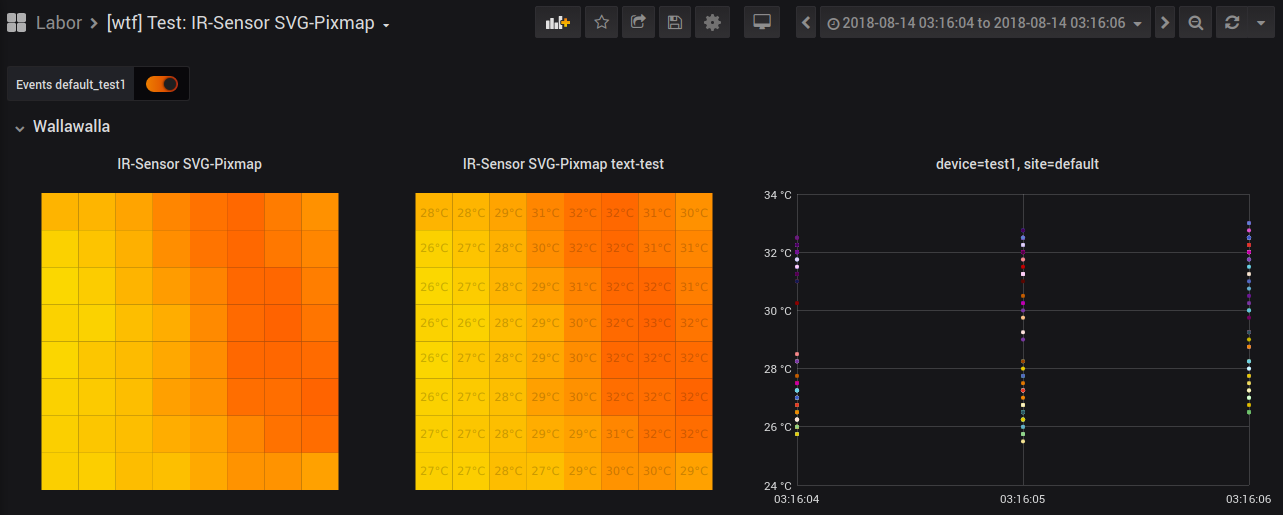
I duplicated this dashboard to Test: IR-Sensor SVG-Pixmap [wtf]. The “SVG-pixmap” on the right shows the “current-value” of the metric. Just hit within the dashboard “timewards” to the future (with a default of a two second time window).
@clemens: Sorry, I think misunderstood the height “rawness” of the color-value of the IR-sensor. Nevertheless @weef and I think that it would be much better to save the data within one instead of 64 measurements (InfluxDB) respectively metrics (Grafana) and use within this measurement 64 different values.
left panel: SVG data
{
"aliasColors": {},
"cacheTimeout": null,
"datasource": "hiveeyes_test_irsensor",<?xml version="1.0" encoding="UTF-8"?>
<!DOCTYPE svg PUBLIC "-//W3C//DTD SVG 1.1//EN" "http://www.w3.org/Graphics/SVG/1.1/DTD/svg11.dtd">
<svg xmlns="http://www.w3.org/2000/svg" xmlns:xlink="http://www.w3.org/1999/xlink" xml:space="preserve" width="100%" height="100%" version="1.1" style="shape-rendering:geometricPrecision; text-rendering:geometricPrecision; image-rendering:optimizeQuality; fill-rule:evenodd; clip-rule:evenodd" viewBox="0 0 100 100">
<defs>
</defs>
<g id="Ebene_x0020_1">
<!-- 1st row, "px" 1 to 8 -->
<rect id="temp-ir-1-1" x="0" y="000" width="12.5%" height="12.5%"/>
<text id="temp-ir-1-1" x="0" y="000" width="12.5%" height="12.5%"></text>
<rect id="temp-ir-1-2" x="12.5" y="000" width="12.5%" height="12.5%"/>
<rect id="temp-ir-1-3" x="25.0" y="000" width="12.5%" height="12.5%"/>
<rect id="temp-ir-1-4" x="37.5" y="000" width="12.5%" height="12.5%"/>
<rect id="temp-ir-1-5" x="50.0" y="000" width="12.5%" height="12.5%"/>
<rect id="temp-ir-1-6" x="62.5" y="000" width="12.5%" height="12.5%"/>
<rect id="temp-ir-1-7" x="75.0" y="000" width="12.5%" height="12.5%"/>
<rect id="temp-ir-1-8" x="87.5" y="000" width="12.5%" height="12.5%"/>
<!-- 2nd row, "px" 1 to 8 -->
<rect id="temp-ir-2-1" x="0" y="12.5" width="12.5%" height="12.5%"/>
<rect id="temp-ir-2-2" x="12.5" y="12.5" width="12.5%" height="12.5%"/>
<rect id="temp-ir-2-3" x="25.0" y="12.5" width="12.5%" height="12.5%"/>
<rect id="temp-ir-2-4" x="37.5" y="12.5" width="12.5%" height="12.5%"/>
<rect id="temp-ir-2-5" x="50.0" y="12.5" width="12.5%" height="12.5%"/>
<rect id="temp-ir-2-6" x="62.5" y="12.5" width="12.5%" height="12.5%"/>
<rect id="temp-ir-2-7" x="75.0" y="12.5" width="12.5%" height="12.5%"/>
<rect id="temp-ir-2-8" x="87.5" y="12.5" width="12.5%" height="12.5%"/>
<!-- 3rd row, "px" 1 to 8 -->
<rect id="temp-ir-3-1" x="0" y="25.0" width="12.5%" height="12.5%"/>
<rect id="temp-ir-3-2" x="12.5" y="25.0" width="12.5%" height="12.5%"/>
<rect id="temp-ir-3-3" x="25.0" y="25.0" width="12.5%" height="12.5%"/>
<rect id="temp-ir-3-4" x="37.5" y="25.0" width="12.5%" height="12.5%"/>
<rect id="temp-ir-3-5" x="50.0" y="25.0" width="12.5%" height="12.5%"/>
<rect id="temp-ir-3-6" x="62.5" y="25.0" width="12.5%" height="12.5%"/>
<rect id="temp-ir-3-7" x="75.0" y="25.0" width="12.5%" height="12.5%"/>
<rect id="temp-ir-3-8" x="87.5" y="25.0" width="12.5%" height="12.5%"/>
<!-- 4th row, "px" 1 to 8 -->
<rect id="temp-ir-4-1" x="0" y="37.5" width="12.5%" height="12.5%"/>
<rect id="temp-ir-4-2" x="12.5" y="37.5" width="12.5%" height="12.5%"/>
<rect id="temp-ir-4-3" x="25.0" y="37.5" width="12.5%" height="12.5%"/>
<rect id="temp-ir-4-4" x="37.5" y="37.5" width="12.5%" height="12.5%"/>
<rect id="temp-ir-4-5" x="50.0" y="37.5" width="12.5%" height="12.5%"/>
<rect id="temp-ir-4-6" x="62.5" y="37.5" width="12.5%" height="12.5%"/>
<rect id="temp-ir-4-7" x="75.0" y="37.5" width="12.5%" height="12.5%"/>
<rect id="temp-ir-4-8" x="87.5" y="37.5" width="12.5%" height="12.5%"/>
<!-- 5th row, "px" 1 to 8 -->
<rect id="temp-ir-5-1" x="0" y="50.0" width="12.5%" height="12.5%"/>
<rect id="temp-ir-5-2" x="12.5" y="50.0" width="12.5%" height="12.5%"/>
<rect id="temp-ir-5-3" x="25.0" y="50.0" width="12.5%" height="12.5%"/>
<rect id="temp-ir-5-4" x="37.5" y="50.0" width="12.5%" height="12.5%"/>
<rect id="temp-ir-5-5" x="50.0" y="50.0" width="12.5%" height="12.5%"/>
<rect id="temp-ir-5-6" x="62.5" y="50.0" width="12.5%" height="12.5%"/>
<rect id="temp-ir-5-7" x="75.0" y="50.0" width="12.5%" height="12.5%"/>
<rect id="temp-ir-5-8" x="87.5" y="50.0" width="12.5%" height="12.5%"/>
<!-- 6th row, "px" 1 to 8 -->
<rect id="temp-ir-6-1" x="0" y="62.5" width="12.5%" height="12.5%"/>
<rect id="temp-ir-6-2" x="12.5" y="62.5" width="12.5%" height="12.5%"/>
<rect id="temp-ir-6-3" x="25.0" y="62.5" width="12.5%" height="12.5%"/>
<rect id="temp-ir-6-4" x="37.5" y="62.5" width="12.5%" height="12.5%"/>
<rect id="temp-ir-6-5" x="50.0" y="62.5" width="12.5%" height="12.5%"/>
<rect id="temp-ir-6-6" x="62.5" y="62.5" width="12.5%" height="12.5%"/>
<rect id="temp-ir-6-7" x="75.0" y="62.5" width="12.5%" height="12.5%"/>
<rect id="temp-ir-6-8" x="87.5" y="62.5" width="12.5%" height="12.5%"/>
<!-- 7th row, "px" 1 to 8 -->
<rect id="temp-ir-7-1" x="0" y="75.0" width="12.5%" height="12.5%"/>
<rect id="temp-ir-7-2" x="12.5" y="75.0" width="12.5%" height="12.5%"/>
<rect id="temp-ir-7-3" x="25.0" y="75.0" width="12.5%" height="12.5%"/>
<rect id="temp-ir-7-4" x="37.5" y="75.0" width="12.5%" height="12.5%"/>
<rect id="temp-ir-7-5" x="50.0" y="75.0" width="12.5%" height="12.5%"/>
<rect id="temp-ir-7-6" x="62.5" y="75.0" width="12.5%" height="12.5%"/>
<rect id="temp-ir-7-7" x="75.0" y="75.0" width="12.5%" height="12.5%"/>
<rect id="temp-ir-7-8" x="87.5" y="75.0" width="12.5%" height="12.5%"/>
<!-- 8th row, "px" 1 to 8 -->
<rect id="temp-ir-8-1" x="0" y="87.5" width="12.5%" height="12.5%"/>
<rect id="temp-ir-8-2" x="12.5" y="87.5" width="12.5%" height="12.5%"/>
<rect id="temp-ir-8-3" x="25.0" y="87.5" width="12.5%" height="12.5%"/>
<rect id="temp-ir-8-4" x="37.5" y="87.5" width="12.5%" height="12.5%"/>
<rect id="temp-ir-8-5" x="50.0" y="87.5" width="12.5%" height="12.5%"/>
<rect id="temp-ir-8-6" x="62.5" y="87.5" width="12.5%" height="12.5%"/>
<rect id="temp-ir-8-7" x="75.0" y="87.5" width="12.5%" height="12.5%"/>
<rect id="temp-ir-8-8" x="87.5" y="87.5" width="12.5%" height="12.5%"/>
</g>
</svg>
"doInit": {},
"format": "short",
"gridPos": {
"h": 13,
"w": 10,
"x": 14,
"y": 1
},
"handleMetric": {},
"id": 4,
"interval": null,
"js_init_code": "",
"links": [],
"maxDataPoints": 3,
"nullPointMode": "connected",
"repositories": {
"rtmaster": {
"url": "https://github.com/rtmaster",
"description": "simple examples",
"license": "Apache 2.0",
"items": [
{
"category": "arrows",
"name": "arrow-up",
"path": "rtmaster/arrows/arrow-up.svg",
"description": "Arrow facing up"
},
{
"category": "arrows",
"name": "arrow-down",
"path": "rtmaster/arrows/arrow-down.svg",
"description": "Arrow facing down"
},
{
"category": "arrows",
"name": "arrow-right",
"path": "rtmaster/arrows/arrow-right.svg",
"description": "Arrow facing right"
},
{
"category": "arrows",
"name": "arrow-left",
"path": "rtmaster/arrows/arrow-left.svg",
"description": "Arrow facing left"
},
{
"category": "arrows",
"name": "arrow-up-right",
"path": "rtmaster/arrows/arrow-up-right.svg",
"description": "Arrow facing up right"
},
{
"category": "arrows",
"name": "arrow-up-left",
"path": "rtmaster/arrows/arrow-up-left.svg",
"description": "Arrow facing up left"
},
{
"category": "arrows",
"name": "arrow-down-left",
"path": "rtmaster/arrows/arrow-down-left.svg",
"description": "Arrow facing down left"
},
{
"category": "arrows",
"name": "arrow-down-right",
"path": "rtmaster/arrows/arrow-down-right.svg",
"description": "Arrow facing down right"
},
{
"category": "arrows",
"name": "arrow-left-right",
"path": "rtmaster/arrows/arrow-left-right.svg",
"description": "Arrow facing left right"
},
{
"category": "arrows",
"name": "arrow-up-down",
"path": "rtmaster/arrows/arrow-up-down.svg",
"description": "Arrow facing up down"
},
{
"category": "arrows",
"name": "arrow-up-down-left-right",
"path": "rtmaster/arrows/arrow-up-down-left-right.svg",
"description": "Arrow facing up down left right"
},
{
"category": "facilities",
"name": "factory",
"path": "rtmaster/facilities/factory.svg",
"description": "Factory"
},
{
"category": "facilities",
"name": "jackup",
"path": "rtmaster/facilities/jackup.svg",
"description": "Jackup"
},
{
"category": "facilities",
"name": "plant",
"path": "rtmaster/facilities/plant.svg",
"description": "Plant"
},
{
"category": "facilities",
"name": "semisub",
"path": "rtmaster/facilities/semisub.svg",
"description": "Semisub"
},
{
"category": "facilities",
"name": "ship",
"path": "rtmaster/facilities/ship.svg",
"description": "Ship"
},
{
"category": "facilities",
"name": "truck",
"path": "rtmaster/facilities/truck.svg",
"description": "Truck"
},
{
"category": "indicators",
"name": "light-bulb",
"path": "rtmaster/indicators/light-bulb.svg",
"description": "Light Bulb"
},
{
"category": "indicators",
"name": "light-green",
"path": "rtmaster/indicators/light-green.svg",
"description": "Green Light Indicator"
},
{
"category": "indicators",
"name": "light-orange",
"path": "rtmaster/indicators/light-orange.svg",
"description": "Orange Light Indicator"
},
{
"category": "indicators",
"name": "light-red",
"path": "rtmaster/indicators/light-red.svg",
"description": "Red Light Indicator"
},
{
"category": "industrial",
"name": "compressor",
"path": "rtmaster/industrial/compressor.svg",
"description": "Compressor"
},
{
"category": "industrial",
"name": "derrick",
"path": "rtmaster/industrial/derrick.svg",
"description": "Derrick"
},
{
"category": "industrial",
"name": "heatexchanger",
"path": "rtmaster/industrial/heatexchanger.svg",
"description": "Heat Exchanger"
},
{
"category": "industrial",
"name": "motor",
"path": "rtmaster/industrial/motor.svg",
"description": "Motor"
},
{
"category": "industrial",
"name": "pump",
"path": "rtmaster/industrial/pump.svg",
"description": "Pump"
},
{
"category": "industrial",
"name": "tank-horizontal",
"path": "rtmaster/industrial/tank-horizontal.svg",
"description": "Horizontal Tank"
},
{
"category": "industrial",
"name": "tank-vertical",
"path": "rtmaster/industrial/tank-vertical.svg",
"description": "Vertical Tank"
},
{
"category": "industrial",
"name": "turbine",
"path": "rtmaster/industrial/turbine.svg",
"description": "Turbine"
},
{
"category": "industrial",
"name": "vessel-horizontal",
"path": "rtmaster/industrial/vessel-horizontal.svg",
"description": "Horizontal Vessel"
},
{
"category": "industrial",
"name": "vessel-vertical",
"path": "rtmaster/industrial/vessel-vertical.svg",
"description": "Vertical Vessel"
},
{
"category": "letters",
"name": "A",
"path": "rtmaster/letters/letter-a.svg",
"description": "A"
},
{
"category": "letters",
"name": "B",
"path": "rtmaster/letters/letter-b.svg",
"description": "B"
},
{
"category": "letters",
"name": "C",
"path": "rtmaster/letters/letter-c.svg",
"description": "C"
},
{
"category": "letters",
"name": "D",
"path": "rtmaster/letters/letter-d.svg",
"description": "D"
},
{
"category": "letters",
"name": "E",
"path": "rtmaster/letters/letter-e.svg",
"description": "E"
},
{
"category": "letters",
"name": "F",
"path": "rtmaster/letters/letter-f.svg",
"description": "F"
},
{
"category": "letters",
"name": "G",
"path": "rtmaster/letters/letter-g.svg",
"description": "G"
},
{
"category": "letters",
"name": "H",
"path": "rtmaster/letters/letter-h.svg",
"description": "H"
},
{
"category": "letters",
"name": "I",
"path": "rtmaster/letters/letter-i.svg",
"description": "I"
},
{
"category": "letters",
"name": "J",
"path": "rtmaster/letters/letter-j.svg",
"description": "J"
},
{
"category": "letters",
"name": "K",
"path": "rtmaster/letters/letter-k.svg",
"description": "K"
},
{
"category": "letters",
"name": "L",
"path": "rtmaster/letters/letter-l.svg",
"description": "L"
},
{
"category": "letters",
"name": "M",
"path": "rtmaster/letters/letter-m.svg",
"description": "M"
},
{
"category": "letters",
"name": "N",
"path": "rtmaster/letters/letter-n.svg",
"description": "N"
},
{
"category": "letters",
"name": "O",
"path": "rtmaster/letters/letter-o.svg",
"description": "O"
},
{
"category": "letters",
"name": "P",
"path": "rtmaster/letters/letter-p.svg",
"description": "P"
},
{
"category": "letters",
"name": "Q",
"path": "rtmaster/letters/letter-q.svg",
"description": "Q"
},
{
"category": "letters",
"name": "R",
"path": "rtmaster/letters-letter-r.svg",
"description": "R"
},
{
"category": "letters",
"name": "S",
"path": "rtmaster/letters/letter-s.svg",
"description": "S"
},
{
"category": "letters",
"name": "T",
"path": "rtmaster/letters/letter-t.svg",
"description": "T"
},
{
"category": "letters",
"name": "U",
"path": "rtmaster/letters/letter-u.svg",
"description": "U"
},
{
"category": "letters",
"name": "V",
"path": "rtmaster/letters/letter-v.svg",
"description": "V"
},
{
"category": "letters",
"name": "W",
"path": "rtmaster/letters/letter-w.svg",
"description": "W"
},
{
"category": "letters",
"name": "X",
"path": "rtmaster/letters/letter-x.svg",
"description": "X"
},
{
"category": "letters",
"name": "Y",
"path": "rtmaster/letters/letter-y.svg",
"description": "Y"
},
{
"category": "letters",
"name": "Z",
"path": "rtmaster/letters/letter-z.svg",
"description": "Z"
},
{
"category": "meters",
"name": "flask",
"path": "rtmaster/meters/flask.svg",
"description": "Laboratory Flask"
},
{
"category": "meters",
"name": "flowmeter",
"path": "rtmaster/meters/flowmeter.svg",
"description": "Flowmeter"
},
{
"category": "meters",
"name": "gauge",
"path": "rtmaster/meters/gauge.svg",
"description": "Gauge"
},
{
"category": "numbers",
"name": "0",
"path": "rtmaster/numbers/number-0.svg",
"description": "0"
},
{
"category": "numbers",
"name": "1",
"path": "rtmaster/numbers/number-1.svg",
"description": "1"
},
{
"category": "numbers",
"name": "2",
"path": "rtmaster/numbers/number-2.svg",
"description": "2"
},
{
"category": "numbers",
"name": "3",
"path": "rtmaster/numbers/number-3.svg",
"description": "3"
},
{
"category": "numbers",
"name": "4",
"path": "rtmaster/numbers/number-4.svg",
"description": "4"
},
{
"category": "numbers",
"name": "5",
"path": "rtmaster/numbers/number-5.svg",
"description": "5"
},
{
"category": "numbers",
"name": "6",
"path": "rtmaster/numbers/number-6.svg",
"description": "6"
},
{
"category": "numbers",
"name": "7",
"path": "rtmaster/numbers/number-7.svg",
"description": "7"
},
{
"category": "numbers",
"name": "8",
"path": "rtmaster/numbers/number-8.svg",
"description": "8"
},
{
"category": "numbers",
"name": "9",
"path": "rtmaster/numbers/number-9.svg",
"description": "9"
},
{
"category": "pipes",
"name": "pipe-curve-down",
"path": "rtmaster/pipes/pipe-curve-down.svg",
"description": "Pipe curve down"
},
{
"category": "pipes",
"name": "pipe-curve-down-left",
"path": "rtmaster/pipes/pipe-curve-down-left.svg",
"description": "Pipe curve down left"
},
{
"category": "pipes",
"name": "pipe-curve-down-right",
"path": "rtmaster/pipes/pipe-curve-down-right.svg",
"description": "Pipe curve down right"
},
{
"category": "pipes",
"name": "pipe-curve-left",
"path": "rtmaster/pipes/pipe-curve-left.svg",
"description": "Pipe curve left"
},
{
"category": "pipes",
"name": "pipe-curve-right",
"path": "rtmaster/pipes/pipe-curve-right.svg",
"description": "Pipe curve right"
},
{
"category": "pipes",
"name": "pipe-curve-up",
"path": "rtmaster/pipes/pipe-curve-up.svg",
"description": "Pipe curve up"
},
{
"category": "pipes",
"name": "pipe-curve-up-left",
"path": "rtmaster/pipes/pipe-curve-up-left.svg",
"description": "Pipe curve up left"
},
{
"category": "pipes",
"name": "pipe-curve-up-right",
"path": "rtmaster/pipes/pipe-curve-up-right.svg",
"description": "Pipe curve up right"
},
{
"category": "pipes",
"name": "pipe-diagonal-left",
"path": "rtmaster/pipes/pipe-diagonal-left.svg",
"description": "Pipe diagonal left"
},
{
"category": "pipes",
"name": "pipe-diagonal-right",
"path": "rtmaster/pipes/pipe-diagonal-right.svg",
"description": "Pipe diagonal right"
},
{
"category": "pipes",
"name": "pipe-flange-horizontal",
"path": "rtmaster/pipes/pipe-flange-horizontal.svg",
"description": "Pipe flange horizontal"
},
{
"category": "pipes",
"name": "pipe-flange-intersection",
"path": "rtmaster/pipes/pipe-flange-intersection.svg",
"description": "Pipe flange intersection"
},
{
"category": "pipes",
"name": "pipe-flange-vertical",
"path": "rtmaster/pipes/pipe-flange-vertical.svg",
"description": "Pipe flange vertical"
},
{
"category": "pipes",
"name": "pipe-horizontal",
"path": "rtmaster/pipes/pipe-horizontal.svg",
"description": "Pipe horizontal"
},
{
"category": "pipes",
"name": "pipe-tee-down",
"path": "rtmaster/pipes/pipe-tee-down.svg",
"description": "Pipe tee down"
},
{
"category": "pipes",
"name": "pipe-tee-left",
"path": "rtmaster/pipes/pipe-tee-left.svg",
"description": "Pipe tee left"
},
{
"category": "pipes",
"name": "pipe-tee-right",
"path": "rtmaster/pipes/pipe-tee-right.svg",
"description": "Pipe tee right"
},
{
"category": "pipes",
"name": "pipe-tee-up",
"path": "rtmaster/pipes/pipe-tee-up",
"description": "Pipe tee up"
},
{
"category": "pipes",
"name": "pipe-vertical",
"path": "rtmaster/pipes/pipe-vertical.svg",
"description": "Pipe vertical"
},
{
"category": "shapes",
"name": "circle",
"path": "rtmaster/shapes/circle.svg",
"description": "Circle"
},
{
"category": "shapes",
"name": "gear",
"path": "rtmaster/shapes/gear.svg",
"description": "Gear"
},
{
"category": "shapes",
"name": "line-horizontal",
"path": "rtmaster/shapes/line-horizontal.svg",
"description": "Line horizontal"
},
{
"category": "shapes",
"name": "line-horizontal-arrow-left",
"path": "rtmaster/shapes/line-horizontal-arrow-left.svg",
"description": "Line horizontal arrow left"
},
{
"category": "shapes",
"name": "line-horizontal-arrow-right",
"path": "rtmaster/shapes/line-horizontal-arrow-right.svg",
"description": "Line horizontal arrow right"
},
{
"category": "shapes",
"name": "line-vertical",
"path": "rtmaster/shapes/line-vertical.svg",
"description": "Line vertical"
},
{
"category": "shapes",
"name": "line-vertical-arrow-down",
"path": "rtmaster/shapes/line-vertical-arrow-down.svg",
"description": "Line vertical arrow down"
},
{
"category": "shapes",
"name": "line-vertical-arrow-up",
"path": "rtmaster/shapes/line-vertical-arrow-up.svg",
"description": "Line vertical arrow up"
},
{
"category": "shapes",
"name": "square",
"path": "rtmaster/shapes/square.svg",
"description": "Square"
},
{
"category": "shapes",
"name": "triangle-down",
"path": "rtmaster/shapes/triangle-down.svg",
"description": "Triangle down"
},
{
"category": "shapes",
"name": "triangle-left",
"path": "rtmaster/shapes/triangle-left.svg",
"description": "Triangle left"
},
{
"category": "shapes",
"name": "triangle-right",
"path": "rtmaster/shapes/triangle-right.svg",
"description": "Triangle right"
},
{
"category": "shapes",
"name": "triangle-up",
"path": "rtmaster/shapes/triangle-up.svg",
"description": "Triangle-up"
},
{
"category": "valves",
"name": "valve-horizontal",
"path": "rtmaster/valves/valve-horizontal.svg",
"description": "Valve Horizontal"
},
{
"category": "valves",
"name": "valve-left-right",
"path": "rtmaster/valves/valve-left-right.svg",
"description": "Valve left right"
},
{
"category": "valves",
"name": "valve-round-down",
"path": "rtmaster/valves/valve-round-down.svg",
"description": "Valve round down"
},
{
"category": "valves",
"name": "valve-round-left",
"path": "rtmaster/valves/valve-round-left.svg",
"description": "Valve round left"
},
{
"category": "valves",
"name": "valve-round-right",
"path": "rtmaster/valves/valve-round-right.svg",
"description": "Valve round right"
},
{
"category": "valves",
"name": "valve-round-up",
"path": "rtmaster/valves/valve-round-up.svg",
"description": "Valve round up"
},
{
"category": "valves",
"name": "valve-square-down",
"path": "rtmaster/valves/valve-square-down.svg",
"description": "Valve square down"
},
{
"category": "valves",
"name": "valve-square-left",
"path": "rtmaster/valves/valve-square-left.svg",
"description": "Valve square left"
},
{
"category": "valves",
"name": "valve-square-right",
"path": "rtmaster/valves/valve-square-right.svg",
"description": "Valve square right"
},
{
"category": "valves",
"name": "valve-square-up",
"path": "rtmaster/valves/valve-square-up.svg",
"description": "Valve square up"
},
{
"category": "valves",
"name": "valve-vertical",
"path": "rtmaster/valves/valve-vertical",
"description": "Valve vertical"
}
]
}
},
"svgBuilderData": {
"elements": [],
"height": "100%",
"viewport": {
"height": 1000,
"width": 1000,
"x": 0,
"y": 0
},
"width": "100%"
},
"targets": [
{
"alias": "",
"groupBy": [
{
"params": [
"$__interval"
],
"type": "time"
},
{
"params": [
"null"
],
"type": "fill"
}
],
"measurement": "default_test1_sensors",
"orderByTime": "ASC",
"policy": "default",
"refId": "A",
"resultFormat": "time_series",
"select": [
[
{
"params": [
"*"
],
"type": "field"
},
{
"params": [],
"type": "mean"
}
]
],
"tags": []
}
],
"title": "IR-Sensor SVG-Pixmap",
"transparent": true,
"type": "marcuscalidus-svg-panel",
"useSVGBuilder": false
}
See JavaScript code in some post below. max post size sucks.