Hi @clemens!
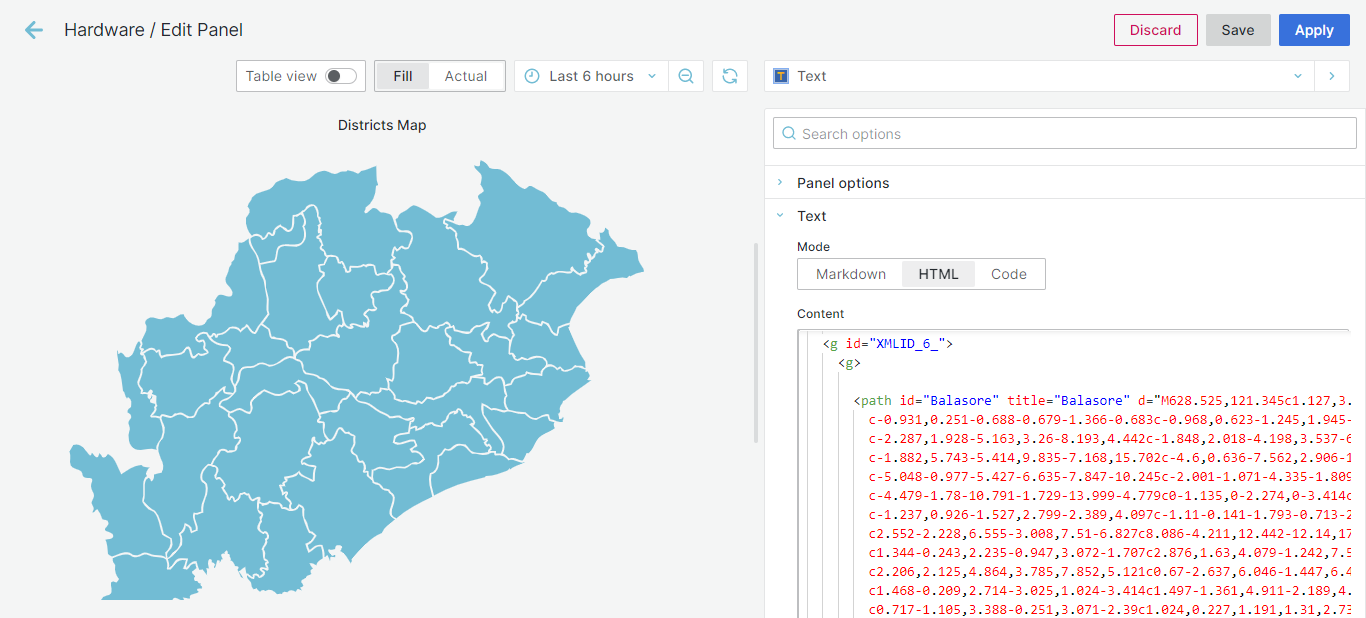
I just had a first success in playing around with the SVG plugin for Grafana, you can have a deep look within this playing-ground-dashboard:
I recommend to install this plugin on swarm, too. :)
First I created that SVG with Inkscape, saved it as “plain SVG” and just copied it within the “SVG-section” of the plugin. I changed the IDs of the relevant elements (tspans for text and circles) to something more human-readable:
<text
   id="t-tempel"
   y="980.20209"
   x="131.12866"
   style="font-size:62.5px;line-height:100%;font-family:'Source Code Pro';-inkscape-font-specification:'Source Code Pro';letter-spacing:0px;word-spacing:0px;fill:#000000;stroke:none;stroke-width:1px;stroke-linecap:butt;stroke-linejoin:miter;stroke-opacity:1"
   xml:space="preserve"><tspan
     style="font-style:normal;font-variant:normal;font-weight:bold;font-stretch:normal;font-size:18.75px;font-family:'Source Code Pro';-inkscape-font-specification:'Source Code Pro Bold';text-align:center;text-anchor:middle"
     y="980.20209"
     x="131.12866"
     id="tspan-tempel">-999°C</tspan></text>
<circle
   r="10"
   cy="950.44965"
   cx="131.31982"
   id="c-tempel"
   style="color:#000000;clip-rule:nonzero;display:inline;overflow:visible;visibility:visible;opacity:1;isolation:auto;mix-blend-mode:normal;color-interpolation:sRGB;color-interpolation-filters:linearRGB;solid-color:#000000;solid-opacity:1;fill:#000000;fill-opacity:1;fill-rule:nonzero;stroke:none;stroke-width:17.71653557;stroke-linecap:butt;stroke-linejoin:miter;stroke-miterlimit:4;stroke-dasharray:none;stroke-dashoffset:0;stroke-opacity:1;marker:none;color-rendering:auto;image-rendering:auto;shape-rendering:auto;text-rendering:auto;enable-background:accumulate" />
Then there’s the “Events-section” for some logics done in JavaScript. In the beginning there are some functions to calculate a color depending on a value, copy-pasted-together from this thread on stackoverflow.
This plugin uses a JavaScript-library called Snap.svg for interacting with the SVG, so the main lines for changing the elements to the current values work like this:
var S = Snap(svgnode);

var t_tegel = S.select("#tspan-tegel");
t_tegel.attr({"#text": ctrl.series[0].stats.current + "°C"});

var c_tegel = S.select("#c-tegel");
c_tegel.attr({"fill": numberToColorHsl( ctrl.series[0].stats.current ) });
As a proof of concept, here is an image from “now-12h” ago: