Developing Grafana Worldmap NG

Hide zoom control and attribution label

Problem

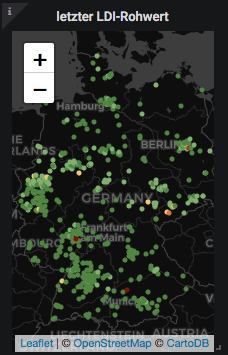
Both control elements (zoom control and attribution) cover too much space on small maps.
image

image

Thoughts

  • Either we should be able resize the controls or hide them altogether.
  • Alternatively, they could be displayed outside of the map in a separate footer area or even at an arbitrary out-of-band location.

Solution

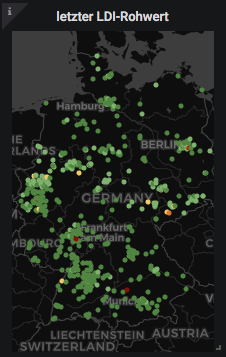
We added the showZoomControl and showAttribution options to accommodate for that. Both default to true so they don’t change the default behavior. When set to false ,
image
small map widgets look more pleasant to us.

Before / After

image image

Appendix: At runtime

// Hide zoom control and attribution.
$('.leaflet-control-zoom').hide();
$('.leaflet-control-attribution').hide();

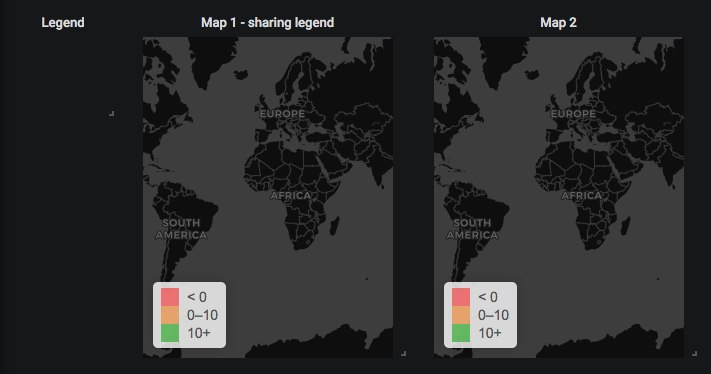
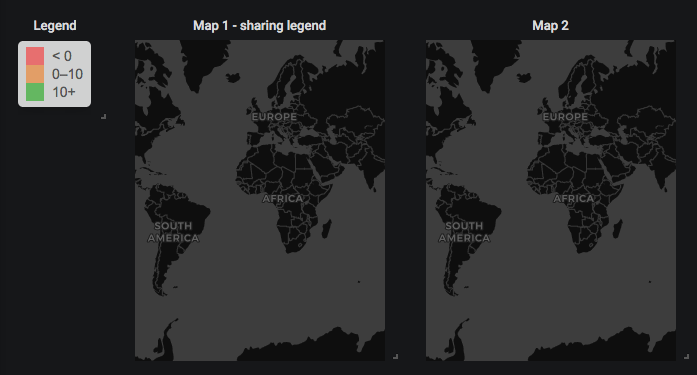
Out-of-band display of map legend

Problem

The legend sometimes covers too much room on small maps.
image

Thoughts

So let’s just display it elsewhere on the dashboard, right?

Solution

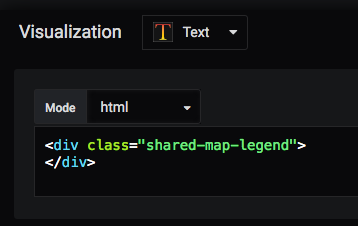
Let’s define a Text-Box which should act as a container element.
image

In the panel settings, the output can be redirected to another DOM element by specifying a jQuery element-selector expression.
image

Before / After


1 Like

Cool! Can you please spend a <center>-tag, too? For the pleasantness!

In order to not encourage copyright-infringements, I suggest a read-only multi-line text-field with the correct attribution (probably prefixed with the panel’s title) in Hypertext (or Markdown), introduced with the words “In order to respect the copyright of many cool people, you should now add this attribution-text somewhere else on the dashboard:”, suddenly appearing after unchecking the “show attribution”-box.

.oO( or shall it automagically create a text-field panel with the attribution-text/html, like within the new legend-option? )

1 Like

Out-of-band attribution for Grafana Map Panel and beyond

I second that. We will see how this would be implemented exactly, thanks for sharing your thoughts.

Labels barely visible on Grafana light theme

Problem

When using the Grafana light theme, popover labels are barely visible.

Solution

dtheb supplied a fix for that the other day. Thanks!

Before

image

After

image

1 Like

Clickthrough links

Introduction

Sticky labels

Daniel Lee already added the feature "stickyLabels": true for this. Thanks!

Research

We know this feature is well-requested already.

Solutions

Implementation

Screens

Variant 1: Assign URL from panel settings.
image

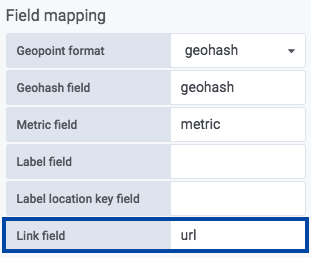
Variant 2: Assign URL from database field.
image

Description

There are two ways of attaching clickthrough-links to circles. Either assign the URL through the corresponding “Clickthrough URL” editor option or take the URL from a database field of the respective data point by using the “Link field” option. By running the outcome through Grafana’s variable interpolation machinery, both dashboard and data point variables will get interpolated at runtime into the strings typed in there as you can see from the first screenshot above.

All dashboard variables will get interpolated 1:1 while values coming from a data point will get prefixed by "__field_" to be able to tell them apart and avoid collisions.

Using the “Clickthrough Window” setting, the panel operator is able to control the designated target browsing context (formerly called “frame”), which is either a named window or one of the well known literal strings “_blank”, “_self”, “_parent” or “_top” with their respective semantics listed below. Using the named window variant, it is easily possible to support dual- and multiscreen-scenarios by just arranging multiple browser windows on different screens.

Currently, the clickthrough-links are attached to the respective circle. Injecting and attaching links into the popover label (see “Sticky labels”) is reserved for some future iteration on that.

Value Description
_self Open the link in the current frame. This is the default behavior.
_blank Open the linked document in a new tab or window, depending on browser configuration.
_parent Open the link in the parent frame, otherwise resorting to _self.
_top Open the link in the top-level frame, otherwise resorting to _self.
frame name Open the link in the named frame.

https://wiki.selfhtml.org/wiki/Referenz:HTML/Attribute/target (sic!)

Details

This is a simple implementation of a panel option being used to navigate to a new URL on click.

https://github.com/hiveeyes/grafana-worldmap-panel/commit/09432e8672d94658273d56856d94e892467f183d

This adds the possibility to obtain the clickthrough-link from the database through the linkField editor option.

Adds clickthrough links mappable from data for circles · panodata/panodata-map-panel@129dd98 · GitHub

Add basic variable interpolation based on keys from dataPoint.
Saying that, all metric values have been added to the dataPoint
beforehand by prefixing them with __field_ to allow for setting
things like clickthroughURL: /url/to/$__field_station_id if
there’s a field called station_id in the current datapoint.

Combine both clickthrough link implementations #129 and #190 · panodata/panodata-map-panel@7a2e825 · GitHub

Use the regular Grafana templating mechanism for interpolating variables into clickthrough links, thus interpolating dashboard and dataPoint variables now.

Use the regular Grafana templating mechanism for interpolating variables · panodata/panodata-map-panel@df86b0d · GitHub

Acknowledgements

Shoutouts to James Nicholls and Leonhard Haas for sharing the contributions referenced above through #129 and #190. Thanks!

1 Like

Variable interpolation all the way down

Apply Grafana-style variable interpolation to all panel settings.

This outlines various details about how the functionality for interpolating values into panel settings has been improved through variables originating from different kinds of sources.

As of now, the interpolation machinery honors the well known Grafana dashboard variables as well as request parameters (prefixed by "request_") and data point fields (prefixed by "__field_").

1. Pull variables from dashboard variables

This enables the interpolation of dashboard variables into each of the panel control settings (source, commit).

Example

An example would be to have a variable called “countrycode” which gets populated by a database query defined by an SQL statement.

SELECT
  country_code AS __value,
  country_name AS __text
FROM
  stations
ORDER BY
  country_code

Then, assigning a value like that to the JSON endpoint URL panel control setting, the machinery would interpolate the selected value assigned to the $countrycode variable appropriately.

image

2. Pull variables from data point fields

Add basic variable interpolation based on keys from dataPoint. Saying that, all metric values have been added to the data point beforehand by prefixing them with "__field_" (source).

Example

If there’s a field called station_id in the current data point, using this inside a panel control option is easy by addressing it with $__field_station_id.

image

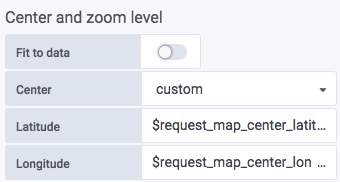
3. Pull variables from URL request parameters

All request parameters from the request URL are now available in the variable interpolation dictionary, prefixed by "request_". This enables using request variables in all panel control options (source, commit).

Example

So, when invoking the dashboard with query parameters like
image
you would be able to use these variables from inside panel control options by assigning them appropriately.
image

4. Override panel control options with URL request parameters

By using request parameters prefixed with “panel-”, it is possible to override the panel control options at runtime (source, commit).

Examples

# Disable zoom control.
https://daq.example.org/d/D1Fx12kWk/magic-dashboard?panel-showZoomControl=false 

# Add clickthrough-link, interpolating the geohash value.
?panel-clickthroughUrl=/path/to/?geohash=$__field_geohash

# Crazyness:
# Interpolate a custom request variable into
# the `clickthroughUrl` setting at runtime.
https://daq.example.org/d/D1Fx12kWk/magic-dashboard?panel-clickthroughUrl=/path/to/?foobar=$request_foobar&foobar=hello

Add map centering to “First geohash”

image

Improvement

We already support the last geohash center, it might be useful to also center on the first geohash received (commit).

Acknowlegements

Thanks for sharing that through #156, Fabien Pomerol.

Add control options "mapFitData" and "mapZoomByRadius"

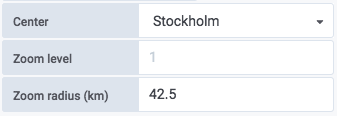
Both editor options provide a more convenient way to determine the viewport (center and zoom level) of the map view. Both features are using Leaflet’s getBoundsZoom() method, which

returns the maximum zoom level on which the given bounds fit to the map view in its entirety.

As the computation of "mapFitData" is based on the real data which actually covers a certain boundary, this should mostly do what I mean.

Fit to data

Enabling this option will choose an optimal center and zoom level for covering the displayed data (source).

image

Zoom radius (km)

This will use a bounding box of a respective circle with the designated radius around the chosen center for determining the viewport (source).

image

Reference

Add control options `mapFitData` and `mapZoomByRadius`. · panodata/panodata-map-panel@ebec3f6 · GitHub

Problem with “Missing geohash value”

TLDR;

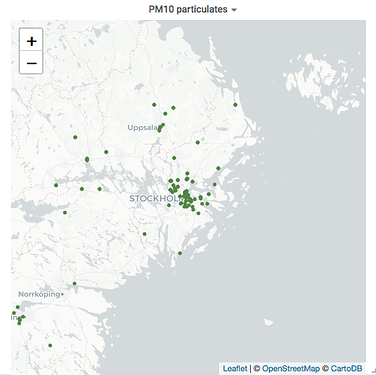
One of our data feeds suddenly started yielding empty "geohash" values into the database. The Worldmap Panel was not amused about it.

Problem

Reason

Proposal

The Worldmap Panel should be able to compensate for that by operating it with an appropriate control option.


Solution: New options for ignoring empty or invalid geohash values

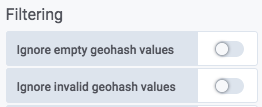
Complementing the options to ignore empty and zero metric values, the options to “Ignore empty geohash values” and “Ignore invalid geohash values” optionally should do what they promise (source, commit).

image

image

Improve Kiosk-mode display

Add ignoreEscapeKey option.

While this amends the global behaviour of Grafana and should probably be implemented elsewhere, it helps us now to prevent the user to leave the Kiosk mode.

https://github.com/hiveeyes/grafana-worldmap-panel/commit/eea48c41d5fd338f841ba29e3d031004ab61671d

Add hideTimepickerNavigation option.

This also amends global behaviour so it should be implemented elsewhere. However, it helps us now to improve Kiosk mode displays.

https://github.com/hiveeyes/grafana-worldmap-panel/commit/e379a8b0de93bbc3a3aca4cbe8d9119c6b37f774

Disable strokes or adjust stroke width

Request


Disable strokes

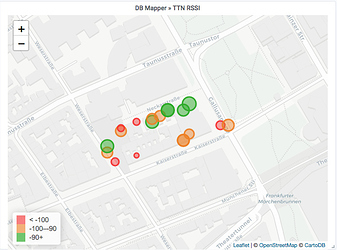
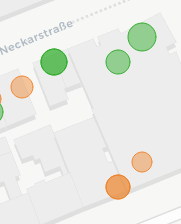
image

Before / After

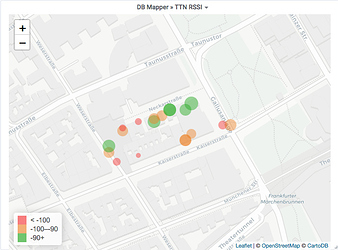
The default is “strokes enabled” with a stroke width of 3 pixels (left side). After disabling strokes, the circles display without borders (right side).


Adjust stroke width

image

Pen Liner borders.
image

Adjust attribution text

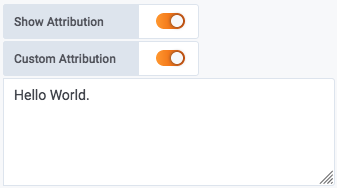
These settings control which alternative text is displayed in the attribution area of the Leaflet map widget (commit).

image

image

Full changelog

v0.3.0-dev

  • Add new mapping options table+json and table+jsonp to retrieve
    location information from JSON endpoint, even for table data.
    The lookup key is the value obtained from the database field
    designated by tableQueryOptions.labelLocationKeyField.
  • Add autoPanLabels and autoWidthLabels to visual option settings.
  • Add zoomControl and attributionControl to visual option settings.
  • Optionally display legend in different DOM element.
  • Increase form field width for JSON endpoint url settings.
  • Fix conditional table options display in settings editor.
  • Add showTableOptions() conditional for signalling any type of table source.
  • Add software tests covering new control options
    • locationData: "table+json"
    • showZoomControl: false
    • showAttribution: false
    • legendContainerSelector
  • Add Makefile for macOS/Homebrew.
  • Fix popover labels text color for light theme (#169).
    Thanks, @dtheb.
  • Add clickthrough option for circles, use fixed url (#129).
    Thanks, @ryft.
  • Add clickthrough option for circles, use urls from data (#190).
    Thanks, @leonhardhaas.
  • Combine both clickthrough link implementations #129 and #190,
    add basic variable interpolation based on keys from dataPoint.
  • Introduce the regular Grafana templating mechanism for interpolating variables
    into clickthrough links. As we are now interpolating dashboard and dataPoint
    variables, the latter one will get prefixed with __field_ to avoid collisions.
  • Apply Grafana-style variable interpolation to all panel settings.
  • Add query parameters into the interpolation dictionary, prefixed by request_.
  • Use request parameters prefixed with “panel-” to optionally override the
    respective control options.
  • Improve map center control handling.
  • Improve clickthroughUrl interpolation.
  • Add control option clickthroughOptions.windowName to open clickthrough target in designated window.
  • Improve centering on Last Geohash.
  • Add support for First Geohash centering (#156).
    Thanks, @fabienpomerol.
  • Add control options mapFitData and mapZoomByRadius.
  • Repaint user interface.
  • Refactor machinery and user interface.
  • Add options ignoreEmptyGeohashValues and ignoreInvalidGeohashValues.
  • Add ignoreEscapeKey option.
  • Add hideTimepickerNavigation option.
  • Add circleOptions.strokeEnabled and circleOptions.strokeWeight.
  • Add options customAttribution and customAttributionText.

grafana-worldmap-panel/CHANGELOG.md at develop · hiveeyes/grafana-worldmap-panel · GitHub

Editor view improvements

Last but not least, the editor view layout has been adjusted to account for the growing number of settings. While being at it, some controls and their mechanics have been improved.

About

Start repainting the user interface (commit)

The number of features and the corresponding editor options already made learning and operating this panel slightly cumbersome. This humbly tries to bring in some fresh air to the user interface in order to improve this situation and make things more clear to the operator.

Refactor machinery and user interface (commit)

This turned out to be a major refactoring and improves the plugin across the board. The editor user interface now is way more clear about what it is aiming at and its interactivity got improved to support the operator while tuning its knobs.

Screens

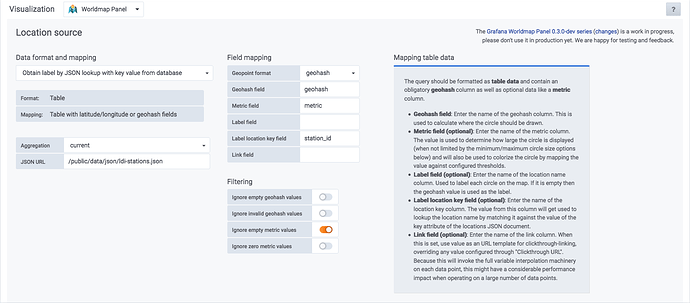
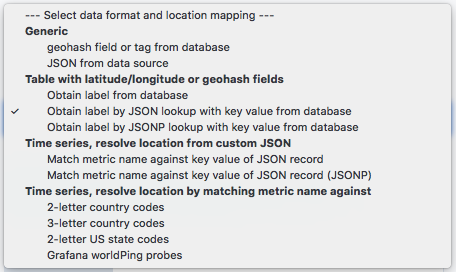
Location source, data format and mapping

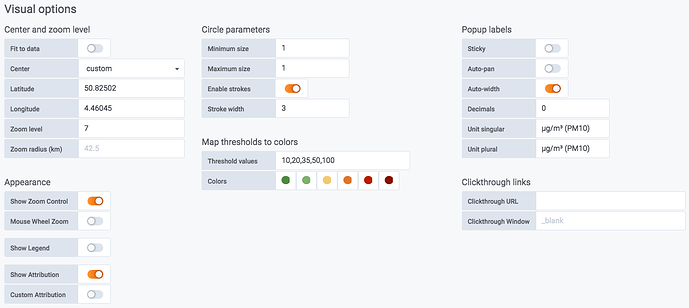
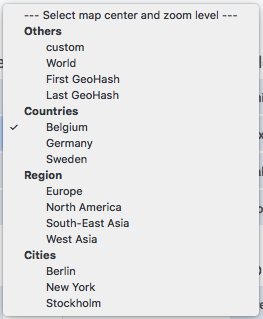
Visual options

Details

Data format and mapping flavor

image

Map viewport defaults (center, zoom level)

image

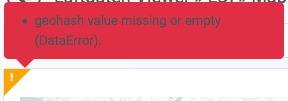
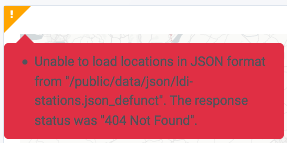
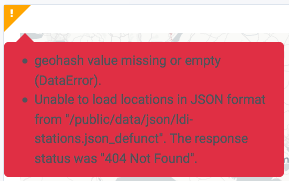
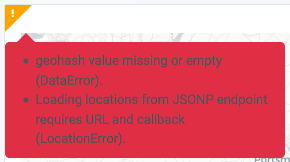
Verbose notifications about warnings and errors

The internal machinery now yields verbose warnings and error messages into the user interface.

About

Refactor machinery and user interface (commit)

Along the lines, appropriate exception and error handling has been introduced to signal error conditions and warnings to the user which helps tremendously when configuring and operating this plugin.

Screens

These are pairs of “invalid setting” <=> “user warning” each. It should give you an idea what this is all about.

Wrong data format selected

image image

Parameters missing

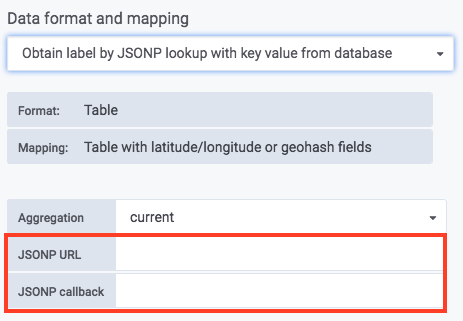
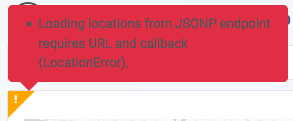
image image

Wrong field names

image image

Failed JSON responses

image image

Multiple error domains

As misconfiguration might have happened at different places and advanced processing sequences might emit notifications at different steps, there might even be multiple error messages originating at different parts of the plugin – let’s call them “application domains” or “subsystems”. Both of the examples below demonstrate this well where one message is originating at the “data domain” and the other one at the “location domain” of the Grafana Worldmap Panel.

Being implemented through a generic ErrorManager, the general idea and main part of this humble notification subsystem might be considered to be used for other plugins as well.

image image

Outlook

Currently, we are using the designated tooltip drop in the upper left panel corner as this is the place Grafana users are accustomed to. However, this might change in the future to display some of this information in the editor view only as some details might have to be hidden from the average user while still being visible to the panel operator.

Hey, great stuff! But … sorry … feature request!

I’d like to define a “max zoom-level” when “fit to data” is enabled. Background: We are drawing two “selected stations from different networks” side-by-side. These might be some blocks away, the default max. zoom-level won’t help for orientation.

Thanks for writing in and reporting this. We have been able to fix this through https://github.com/panodata/grafana-map-panel/issues/2. Have fun!

Quo vadis

We wanted to let you know that the development of the improved Grafana Map Panel already has moved on to the Panodata Initiative. You might enjoy reading about all new features and improvements on its new canonical documentation page.

Setup

Installing the most recent version of the Grafana Map Panel is easy as we are now building and publishing installation packages. Instructions are outlined within the documentation section Setup Grafana Map Panel.

Outlook

We will be happy to receive further contributions from the community and would like to encourage you to send pull requests to this repository we are trying to maintain steadily. We will also be happy to see you join the discussion about Developing Grafana Map Panel or just follow the development process.