Worldmap Panel: Popup overlay verbessern
Wünsche
- Bessere Formatierungsmöglichkeiten.
- Mehr Metadaten anzeigen.
- You name it. (einfach hier eintragen)
Vorher
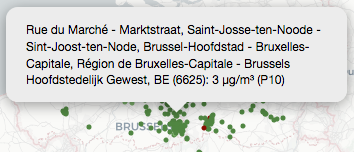
Nachher
Idee: Overlay irgendwie mit sowas wie Boom Table gestaltbar machen.
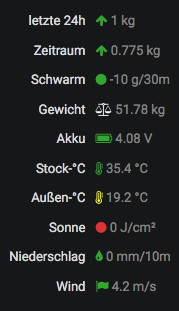

Idee: Overlay irgendwie mit sowas wie Boom Table gestaltbar machen.

Pluseinself! Da muss das Hover-Tooltip wohl ne Sekunde stehenbleiben, innerhalb der mensch die Chance bekommt den Maus-Fokus auf des Tooltip zu schieben auf dass es ab dann solange stehen bleibt wie der Mausfokus drauf ist (oder eben dann auch noch ne Sekunde länger)</laut denk>
[edit: direkt auch auf den Punkt klicken und damit den Link[tm] aufzurufen wär natürlich auch schon knorke!]
Eat "stickyLabels": true for this.
Render Markdown text coming from a (remote) data source.
Ich würde gerne z.B. die Inhalte der Text Panels von luftdaten-info-verlauf gerne irgendwie von der Ferne laden, am besten direkt aus einem GitHub Repository. Derzeit sind sie in Markdown geschrieben.
Das hört sich interessant an, ich könnte mir schon in etwa vorstellen worauf Du hinaus willst. Können wir gerne bei Gelegenheit besprechen.
There are three Panel Plugins for superimposing metrics on top of an image that we know of. Let’s compare their features against each other.
Ich hab grade auch keine Ahnung. Auf jeden Fall ist mir vorhin folgendes aufgefallen: Wenn man die Kreisgröße nicht limitiert, sondern auf den Standardeinstellungen

lässt, erhält man beim initialen Laden Schattenartefakte wie bei
Während man sich im Editor befindet, fällt das kaum auf, weil dort das Aktualisierungsverhalten deutlich agiler implementiert ist. Erst wenn man das Dashboard frisch lädt, fällt einem das auf die Schnauze.
Natürlich könnte man auf diese Art und Weise wunderbarst min-/max-/avg-Werte am gleichen Fleck darstellen, in diesem Fall fließen allerdings wirklich nur einzelne Datenpunkte rein, zumindest wenn alles mit rechten Dingen zugeht.
![]()
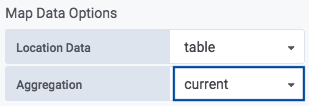
Ich bin einigermaßen ratlos und mir natürlich nicht sicher, ob ich an dieser Stelle falsch denke oder es tatsächlich ein Bug ist.
Gut, es sind die “null” Werte
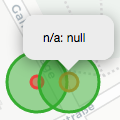
die auftreten, sobald man die Datenquelle folgendermaßen konfiguriert hat
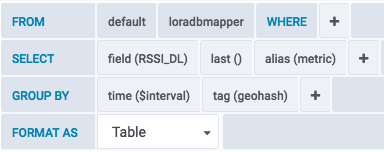
SELECT last("RSSI_DL") AS "metric"
FROM "loradbmapper"
WHERE $timeFilter
GROUP BY time($interval), "geohash"
Dann nämlich sehen die von der Datenquelle gelieferten Datenpunkte folgendermaßen aus:
{
    "columns": [
        "time",
        "metric"
    ],
    "name": "loradbmapper",
    "tags": {
        "geohash": "u0yjj64s2"
    },
    "values": [
        [
            1556496000000,
            null
        ],
        [
            1556582400000,
            -104
        ]
    ]
}
Kompensieren kann man das dann zwar wieder per

insgesamt fühlt es sich aber wie ein Workaround an. Schließlich nimmt Leaflet.js die Punkte nach einem Refresh ohnehin wieder weg – auch ohne das entsprechende Kompensationsfeature. Hm.
Am besten ohne Gruppierung über die Zeit machen à la
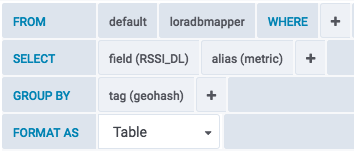
Grafana hängt dann automatisch den Zeitraum dran, siehe
SELECT "RSSI_DL" AS "metric"
FROM "loradbmapper"
WHERE time >= 1556575200000ms and time <= 1556661600000ms
GROUP BY "geohash"
Das Ergebnis enthält dann von vornherein keine null Werte.
{
    "columns": [
        "time",
        "metric"
    ],
    "name": "loradbmapper",
    "tags": {
        "geohash": "u0yjj64s2"
    },
    "values": [
        [
            1556623849462,
            -104
        ]
    ]
}
One of our data feeds suddenly started yielding empty "geohash" values into the database. The Worldmap Panel was not amused about it.
The Worldmap Panel should be able to compensate for that by operating it with an appropriate control option like “ignoreGeohashDecodingErrors”.
Ich stelle mir natürlich irgendwie trotzdem die Frage, warum null-Werte mit einem Kreis dargestellt werden, der einen so großen Radius hat.
Beim Code
kommt nun noch ein
if (dataPointValue == 0) {
  return circleMinSize;
}
hinzu. Das sorgt dafür, dass "null"-Werte mit der eingestellten minimalen Kreisgröße dargestellt werden. Zumindest, sofern nicht die Option “Ignore empty values” gewählt wurde. Falls diese aktiviert ist, werden "null"-Werte komplett unterdrückt.
Themen bei Grafana, die u.U. dazu passen:
In other words: Es wäre nett, wenn man die Variablenauswahl nicht zwingend “topmost” im Seitenlayout anlegen müsste, sondern man sie z.B. in ein Panel verlagern könnte, um sie flexibler positionieren zu können.
Bei Grafana Dashboard Imrovements - Site Feedback - Grafana Labs Community Forums gibt es grade frisch ähnliche Wünsche:
What we kind of already did with grafana-studio.js and Improve Kiosk-mode display in our context already is also something which resonates with others in general, see How To Customize elements in dashboard page - Support - Grafana Community.
Sometimes, we had to SQL-CAST variables into Strings (VARCHAR) as we thought it would be obligatory for Grafana.
Like that.
SELECT osm_country_code, state_and_city, name_and_id, sensor_type_name
FROM irceline_network
WHERE
    station_id IN ($irceline_station_id) AND
    CAST (sensor_type_id AS VARCHAR) IN ($irceline_station_sensortype)
ORDER BY osm_country_code, state_and_city, name_and_id, sensor_type_name;
which would yield
SELECT osm_country_code, state_and_city, name_and_id, sensor_type_name
FROM irceline_network
WHERE
    station_id IN ('1234','1118') AND
    CAST (sensor_type_id AS VARCHAR) IN ('482','20','391','71','10','4013','431','464','8','38','7','5','6002','6001','62106','1','62101','21','61102','61110')
ORDER BY osm_country_code, state_and_city, name_and_id, sensor_type_name;
However, we just found through Using Variables to dynamically select Columns in MySQL - Support - Grafana Community that multi-value variables can be rendered/formatted without quoting each single value, see also Variables | Grafana Documentation.
This works like a charm, we tried it by using ${irceline_station_id:csv} and ${irceline_station_sensortype:csv} in the following query.
SELECT osm_country_code, state_and_city, name_and_id, sensor_type_name
FROM irceline_network
WHERE
    station_id IN (${irceline_station_id:csv}) AND
    sensor_type_id IN (${irceline_station_sensortype:csv})
ORDER BY osm_country_code, state_and_city, name_and_id, sensor_type_name;
SELECT osm_country_code, state_and_city, name_and_id, sensor_type_name
FROM irceline_network
WHERE
    station_id IN (1234,1118) AND
    sensor_type_id IN (482,20,391,71,10,4013,431,464,8,38,7,5,6002,6001,62106,1,62101,21,61102,61110)
ORDER BY osm_country_code, state_and_city, name_and_id, sensor_type_name;
at places where they are not yet possible. Here: Worldmap Panel again.
Q: Is this of interest for us?
Interesting things at Grafana. Ping, @wtf.
Didn’t get into the details what this is exactly all about, yet. However, this came from an answer to one of our ramblings.