Auf einen Blick
Seit dem letzten Kotori release 0.21.1 stellt Euch die Datensammelplattform neue Arten von Instant Dashboards zur Verfügung, die für eine imkerliche Betrachtungsweise geeigneter sind als die bisherigen generischen automatisch erstellten Dashboards. Hier sind viele Erfahrungen mit der einzigartigen Visualisierungssoftware Grafana eingeflossen, die wir während des letzten Jahres sammeln durften.
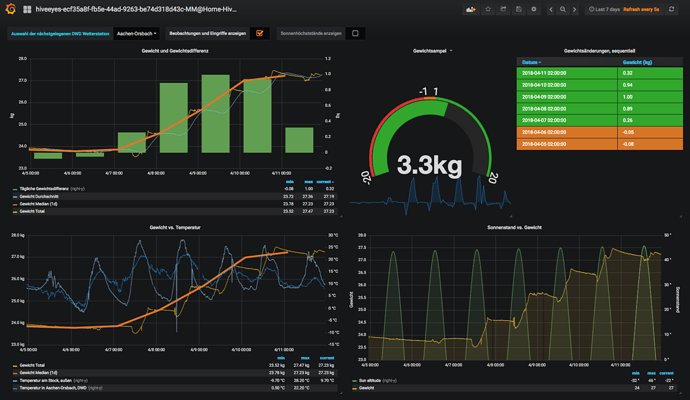
Thematisch geht es primär um Erkenntnisse unseres wichtigsten Sensors, der Stockwaage. Man erhält nun standardmäßig eine gute Übersicht über die Entwicklung der Gewichtsmessungen der letzten sieben Tage. Folgende “Panels” (das sind die Bestandteile eines Dashboards) haben wir dazu realisiert:
- Zeitseriendatenanzeige von Gewicht und Gewichtsdifferenz in Form eines Graphen
- Die “Gewichtsampel”, die sowohl das aktuelle Gesamtgewicht als auch den Trend kompakt anzeigt
- Die Gewichtsänderungen in tabellarischer Form
- Die Gewichtsentwicklung gegenüber der Außentemperatur am Stock, unterstützt von zusätzlichen Messwerten des Deutschen Wetterdienstes (DWD)
- Die Gewichtsentwicklung gegenüber dem Sonnenstand
Wie immer sagt ein Bild mehr als tausend Worte:
Wir wünschen Euch viel Freude am Gerät und bedanken uns ganz herzlich bei @weef, der den Prototypen dieses Dashboards realisiert hat und bei @wtf, der über das Datenmischwerk seit einiger Zeit Informationen von Wetterstationen des Deutschen Wetterdienstes (DWD) zur Verfügung stellt.
At a glance
Since the last Kotori release 0.21.1, the data collection platform offers new kinds of Instant Dashboards, which are more suitable for a beekeeping approach than the previous generic auto-generated dashboards. Here, we used many experiences with the unique visualization software Grafana, which we have been able to collect during the last year.
The dashboard is primarily about insights from our most important sensor, the beehive scale. From now on, this will instantly give you a good overview of the trend of weight measurements over the last seven days. We have implemented the following “panels” (the parts of a dashboard):
- Time series data display of weight and weight difference in the form of a graph
- The “weight traffic light”, which tightly displays both the current total weight and the trend
- The weight changes in tabular form
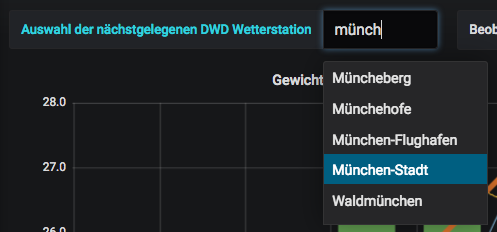
- The weight compared to the outside temperature, supported by additional measurements from sensors of the German Weather Service (DWD)
- The weight compared to the position of the sun
As always, a picture says more than a thousand words:
We wish you much pleasure using the new feature and want to say big thanks to @weef, who made this dashboard become alive and to @wtf, who started feeding information from weather stations of the German Weather Service (DWD) into the system recently, see also Datenmischwerk.

