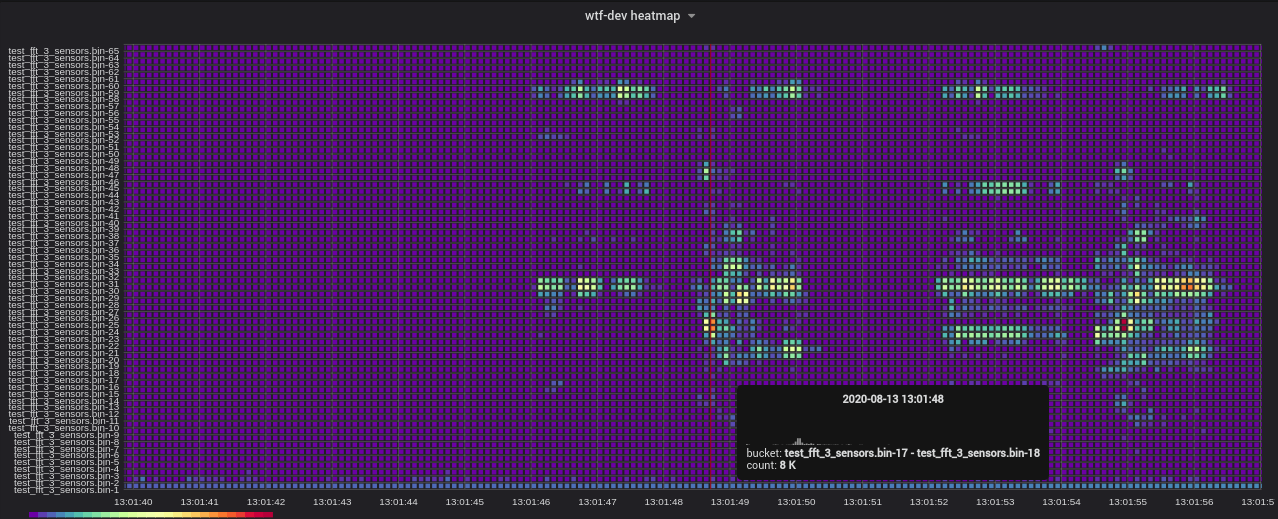
I’ve tried to rebuild Diren’s heatmap graph but I struggeled
https://swarm.hiveeyes.org/grafana/d/xrIkDySGk/hiveeyes-open-hive-testdrive-test-fft-3?tab=queries&panelId=11&edit&fullscreen&orgId=2&from=1597316497803&to=1597316623670
Import via Historische Daten im CSV-Format importieren
echo '## Date/Time,bin-1,bin-2,bin-3,bin-4,bin-5,bin-6,bin-7,bin-8,bin-9,bin-10,bin-11,bin-12,bin-13,bin-14,bin-15,bin-16,bin-17,bin-18,bin-19,bin-20,bin-21,bin-22,bin-23,bin-24,bin-25,bin-26,bin-27,bin-28,bin-29,bin-30,bin-31,bin-32,bin-33,bin-34,bin-35,bin-36,bin-37,bin-38,bin-39,bin-40,bin-41,bin-42,bin-43,bin-44,bin-45,bin-46,bin-47,bin-48,bin-49,bin-50,bin-51,bin-52,bin-53,bin-54,bin-55,bin-56,bin-57,bin-58,bin-59,bin-60,bin-61,bin-62,bin-63,bin-64,bin-65' | http POST https://swarm.hiveeyes.org/api/hiveeyes/open-hive-testdrive/test-fft/3/data Content-Type:text/csv
and
cat data-test-fft_01.txt | http POST https://swarm.hiveeyes.org/api/hiveeyes/open-hive-testdrive/test-fft/3/data Content-Type:text/csv --timeout 500
Data example
2020-08-13 13:01:38.826,16095,434716,281880,0,80264,0,46340,0,0,0,0,0,0,0,0,0,0,0,0,0,0,0,0,0,0,0,0,0,0,0,0,0,0,0,0,0,0,0,0,0,0,0,0,0,0,0,0,0,0,0,0,0,0,0,0,0,0,0,0,0,0,0,0,0,0,
2020-08-13 13:01:38.826,16111,361934,231704,0,65535,0,46340,0,0,0,0,0,0,0,0,0,0,0,0,0,0,0,0,0,0,0,0,0,0,0,0,0,0,0,0,0,0,0,0,0,0,0,0,0,0,0,0,0,0,0,0,0,0,0,0,0,0,0,0,0,0,0,0,0,0,
2020-08-13 13:01:38.826,16127,314299,196607,0,65535,0,0,0,0,0,0,0,0,0,0,0,0,0,0,0,0,0,0,0,0,0,0,0,0,0,0,0,0,0,0,0,0,0,0,0,0,0,0,0,0,0,0,0,0,0,0,0,0,0,0,0,0,0,0,0,0,0,0,0,0,
2020-08-13 13:01:38.845,16143,270211,173391,0,46340,0,0,0,0,0,0,0,0,0,0,0,0,0,0,0,0,0,0,0,0,0,0,0,0,0,0,0,0,0,0,0,0,0,0,0,0,0,0,0,0,0,0,0,0,0,0,0,0,0,0,0,0,0,0,0,0,0,0,0,0,
2020-08-13 13:01:38.845,16159,167084,103621,0,0,0,0,0,0,0,0,0,0,0,0,0,0,0,0,0,0,0,0,0,0,0,0,0,0,0,0,0,0,0,0,0,0,0,0,0,0,0,0,0,0,0,0,0,0,0,0,0,0,0,0,0,0,0,0,0,0,0,0,0,0,
2020-08-13 13:01:38.845,16175,122606,65535,0,0,0,0,0,0,0,0,0,0,0,0,0,0,0,0,0,0,0,0,0,0,0,0,0,0,0,0,0,0,0,0,0,0,0,0,0,0,0,0,0,0,0,0,0,0,0,0,0,0,0,0,0,0,0,0,0,0,0,0,0,0,
2020-08-13 13:01:38.845,16191,103621,65535,0,0,0,0,0,0,0,0,0,0,0,0,0,0,0,0,0,0,0,0,0,0,0,0,0,0,0,0,0,0,0,0,0,0,0,0,0,0,0,0,0,0,0,0,0,0,0,0,0,0,0,0,0,0,0,0,0,0,0,0,0,0,
2020-08-13 13:01:38.845,16207,0,0,0,0,0,0,0,0,0,0,0,0,0,0,0,0,0,0,0,0,0,0,0,0,0,0,0,0,0,0,0,0,0,0,0,0,0,0,0,0,0,0,0,0,0,0,0,0,0,0,0,0,0,0,0,0,0,0,0,0,0,0,0,0,
2020-08-13 13:01:38.845,16223,0,0,0,0,0,0,0,0,0,0,0,0,0,0,0,0,0,0,0,0,0,0,0,0,0,0,0,0,0,0,0,0,0,0,0,0,0,0,0,0,0,0,0,0,0,0,0,0,0,0,0,0,0,0,0,0,0,0,0,0,0,0,0,0,
2020-08-13 13:01:38.845,16239,0,0,0,0,0,0,0,0,0,0,0,0,0,0,0,0,0,0,0,0,0,0,0,0,0,0,0,0,0,0,0,0,0,0,0,0,0,0,0,0,0,0,0,0,0,0,0,0,0,0,0,0,0,0,0,0,0,0,0,0,0,0,0,0,
2020-08-13 13:01:38.856,16255,65535,0,0,0,0,0,0,0,0,0,0,0,0,0,0,0,0,0,0,0,0,0,0,0,0,0,0,0,0,0,0,0,0,0,0,0,0,0,0,0,0,0,0,0,0,0,0,0,0,0,0,0,0,0,0,0,0,0,0,0,0,0,0,0,
2020-08-13 13:01:38.856,16271,122606,80264,0,0,0,0,0,0,0,0,0,0,0,0,0,0,0,0,0,0,0,0,0,0,0,0,0,0,0,0,0,0,0,0,0,0,0,0,0,0,0,0,0,0,0,0,0,0,0,0,0,0,0,0,0,0,0,0,0,0,0,0,0,0,