Introduction
Within Maintenance mode galore, we rambled a bit about how to bring a maintenance mode to the Terkin appliance. A spin-off of this is a control component within Grafana – a thing I always wanted to create a dedicated topic for. So, here we are.
Research
1. Requests from the community
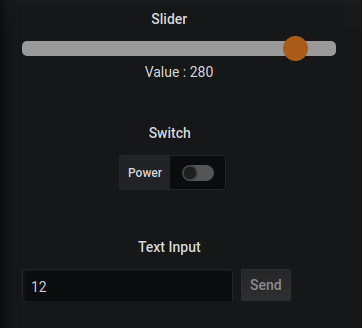
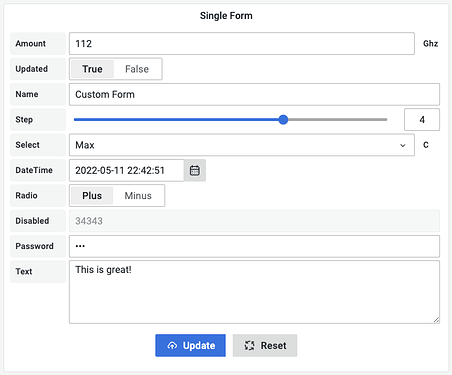
Others within the Grafana community are looking into the same direction. We collected some resources about corresponding requests and suggestions.
More resources
- https://medium.com/worldsensing-techblog/build-your-iot-frontend-with-grafana-36b1113d7d4b
- Can Grafana act as control panel? - Grafana Plugin Development - Grafana Labs Community Forums
- Invoking "alert-success" toaster from Text html Panel - Grafana - Grafana Labs Community Forums
- IoT dashboard sends command to sensors - Grafana Labs Community Forums
- Insert data via plugin - Grafana Plugin Development - Grafana Labs Community Forums
Example screenshots
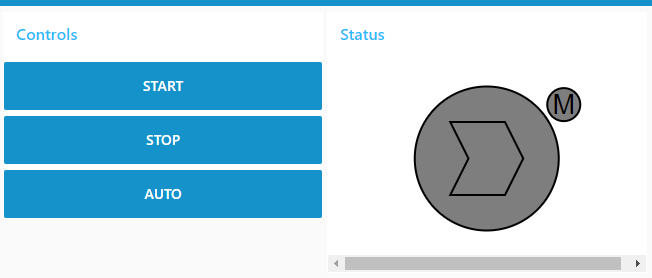
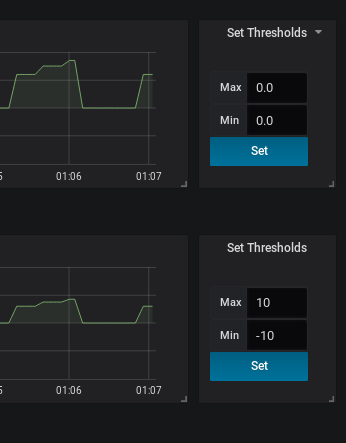
2. In the wild
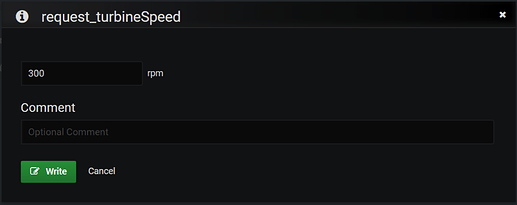
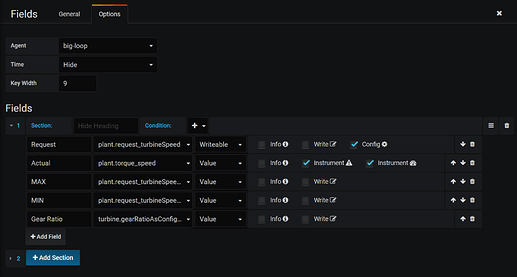
Ryan McKinley already deployed such a “Field Display / Editor” component while working on the measurement and control system for Natel Energy. I found two short appearances within Ryan’s presentations.
- Running a Power Plant with Grafana – Ryan McKinley (Natel Energy)
- https://grafana.com/files/grafanacon_eu_2018/Ryan_McKinley_GrafanaCon_EU_2018.pdf, p. 37 ff.

