As Grafana 6.0 Beta1 has been released today, we want to share http://docs.grafana.org/guides/whats-new-in-v6-0/. Enjoy!
Hi there,
while Grafana 6.1.0 is in the making, we upgraded our staging instance from Grafana 6.0.0 to Grafana 6.1.0 and its plugins to their most recent versions.
Grafana 6.1.0-pre
Before: Grafana v6.0.0-beta1 (commit: d7f81c4)
After:  Grafana v6.1.0-pre   (commit: fd8d45f)
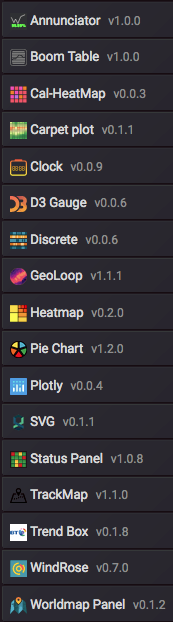
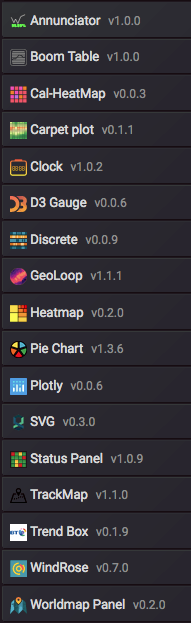
Plugins
/opt/grafana6/bin/grafana-cli --pluginsDir /opt/grafana6/data/plugins plugins upgrade-all
Before | After
Configuration
After the installation, the whole configuration (database and plugins) from the current production instance has been copied to the new one:
cp /opt/grafana-6.0.0-beta1/conf/defaults.ini /opt/grafana-6.1.0-072806e4pre/conf/defaults.ini
cp -r /var/lib/grafana/* /opt/grafana-6.1.0-072806e4pre/data/
Status
It’s still sitting at Grafana6 at weather.hiveeyes.org. Enjoy!
Cheers,
Andreas.
P.S.: As we might happen to be avid “Heatmap Panel” users, please have a look at Some bugs and potential improvements with heatmap panel · Issue #15683 · grafana/grafana · GitHub.
1. Broken discrete plot
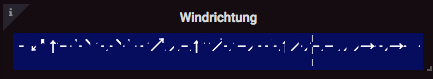
– https://weather.hiveeyes.org/grafana6/d/yvDqn8Zmk/stationsansicht
2. Bienenwetter
Ist hier beim Neuzugang https://weather.hiveeyes.org/grafana6/d/plVhGKdik/bienenwetter-freiland-potsdam alles koscher? Auch bei den Panels in den eingeklappten Bereichen?
Funktioniert alles schön.
Leider hat sich das Verhalten des Grafana-buttons links oben geändert: bei der bisherigen Version klappt es die left bar zu (wollte ich @clemens empfehlen, damit das boom-panel mehr Platz hat), und bei der 6 ist da die base url dahinter. Kannst Du bitte mal nachsehen, ob es da ein einstellbares Verhalten beim config gibt?
2 Likes
Hi @weef,
Ich hab hier leider nichts entdecken können, auch im grafana/CHANGELOG.md at main · grafana/grafana · GitHub findet sich nichts über ein geändertes Verhalten, was ins Auge sticht. Folgende Literatur gibt es zum Thema:
- How to hide the left menu bar when share a dashboard? - Grafana Labs Community Forums
- https://github.com/grafana/grafana/issues/10642
- 5.0: Mouse scrolling does not prevent side-bar auto-hide. · Issue #10643 · grafana/grafana · GitHub
- Sidebar -> Top nav bar · Issue #13573 · grafana/grafana · GitHub
Ich glaube derzeit wird das einfach über den View-Mode (Full, Kiosk, TV, whatever) gesteuert, also dort:
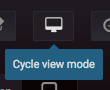
Viele Grüße,
Andreas.
Grafana 6 befindet sich grade ordentlich in der Ausreifungsphase. Fixes all over the place. Siehe
Upgrading to Grafana 6.1.3
Installation
wget https://dl.grafana.com/oss/release/grafana-6.1.3.linux-amd64.tar.gz
cd /opt
tar -xzf ~/install/grafana-6.1.3.linux-amd64.tar.gz
Configuration
After the installation, the whole configuration (database and plugins) from the current production instance has been copied to the new one
mkdir /opt/grafana-6.1.3/data
cp -r /var/lib/grafana/* /opt/grafana-6.1.3/data/
while the configuration file has been reused from grafana-6.1.0 we have been running before
cp grafana-6.1.0-072806e4pre/conf/defaults.ini grafana-6.1.3/conf/defaults.ini
Finally
chown -R grafana:grafana /opt/grafana-6.1.3
Switching gears
Watch logfile
tail -F /opt/grafana6/data/log/grafana.log
Perform switchover
systemctl stop grafana6-server

cd /opt
rm grafana6
ln -sf grafana-6.1.3 grafana6

/opt/grafana6/bin/grafana-cli --pluginsDir /opt/grafana6/data/plugins plugins upgrade-all

systemctl start grafana6-server
Grafana 6.1.4 (2019-04-16)
Bug Fixes
- DataPanel : Added missing built-in interval variables to scopedVars. #16556, @torkelo
- Explore : Adds maxDataPoints to data source query options . #16513, @hugohaggmark
- Explore : Fixes so intervals are recalculated on run query. #16510, @hugohaggmark
- Heatmap : Fix for empty graph when panel is too narrow (#16378). #16460, @alexanderzobnin
- Heatmap : Fixed auto decimals when bucket name is not number. #16609, @torkelo
- QueryInspector : Now shows error responses again. #16514, @torkelo
Grafana 6.2.0 (2019-05-22)
Today, Grafana 6.2 has been released. Enjoy reading the release notes and browsing the demos.
Demo Dashboard new-features-in-v6-2.
Neue Einstellungen
Mindestens ab Grafana 6.2. Gerade angewendet auf https://weather.hiveeyes.org/grafana6/. Merci, @wtf.
[panels] configuration setting
[panels]
# If set to true Grafana will allow script tags in text panels.
# Not recommended as it enable XSS vulnerabilities.
disable_sanitize_html = true

# Set to true if you want to test alpha plugins
# that are not yet ready for general usage.
enable_alpha = true
allow_embedding security setting
[security]
# Set to true if you want to allow browsers to render Grafana
# in a <frame>, <iframe>, <embed> or <object>. Default is false.
allow_embedding = true