Hi Andreas,
I have been cleaning up the numerous dashboards we had on Grafana,
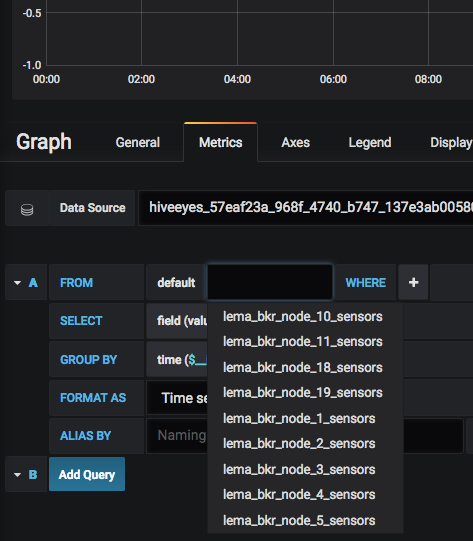
I only kept the original one hiveeyes-57eaf23a-968f-4740-b747-137e3ab00580
Then also changed a bit the naming convention of gateway/node to 'hiveeyes/57eaf23a-968f-4740-b747-137e3ab00580/lemabkr/scale01/‘
I also found an error on the humidity handling, that could explain your remarks below.
I think some new data has been sent this evening at around 23:45
But I am not able to find this new data on the list of data sources. I only see the old sources (see below)
Two options : either I blocked the database again, or I am not able to find the new data sources in the interface.
Could you please give me some advice?
Thanks!
Hi Lorenzo,
as far as we can see, only two dashboards have been provisioned last night:
2018-06-08T22:43:03+0200 [kotori.vendor.hiveeyes.application ] INFO    : Provisioning Grafana dashboard "hiveeyes-testdrive-area-43-node-2" for database "hiveey
es_testdrive" and measurement "area_43_node_2_sensors"
[...]
2018-06-08T22:58:03+0200 [kotori.vendor.hiveeyes.application ] INFO    : Provisioning Grafana dashboard "hiveeyes-testdrive-area-43-node-3" for database "hiveey
es_testdrive" and measurement "area_43_node_3_sensors"
However, Kotori might have cached the knowledge about having a dashboard created already. We restarted the service and humbly ask you to try again.
With kind regards,
Andreas.
Hi Andreas,
Thank you for your (quick!) feedback
I think I understood what was happening,
I was sending data with my own credentials but to Geraldine’s ID, an error appeared pointing the mismatch
hiveeyes/57eaf23a-968f-4740-b747-137e3ab00580/lemabkr/scale01/error.json {
"timestamp": "2018-06-09T06:06:27+00:00",

"message": "Precondition failed: version-mismatch (`The dashboard has been changed by someone else`)",

"type": "<class 'grafana_api_client.GrafanaPreconditionFailedError'>",

"description": "Error processing MQTT message \"{\"PoidsCell2\": \"11630.13\"}\" from topic \"hiveeyes/57eaf23a-968f-4740-b747-137e3ab00580/lemabkr/scale01/data.json\"."
}
That should be corrected. Data is already appearing on eb87a9f4-b25a-4c7c-a29c-c05bb80f1f2c
The only missing thing by now is to reduce the frequency of the data,
I plan to do it this evening.
Have a good day
Lorenzo