Einleitung
Mit dem Programm "grafannotate" - A command line tool to create annotations in Grafana können Annotationen im Grafana nicht-interaktiv angelegt werden. Sowohl die Annotation von diskreten Zeitpunkten (point-in-time) als auch von Zeitbereichen (time-region) ist damit möglich.
Installation
Per Python virtualenv.
virtualenv ~/.hiveeyes-tools
~/.hiveeyes-tools/bin/pip install grafannotate
echo 'alias grafannotate=~/.hiveeyes-tools/bin/grafannotate' >> ~/.bash_profile
Pre-flight checks
Dies sollte auf jeden Fall erstmal klappen.
grafannotate --help
Konfiguration
Damit alles ordnungsgemäß funktioniert, muss man die Annotationen im Dashboard so einrichten wie bei Interaktiv im Grafana erzeugte Annotationen zwischen verschiedenen Panels und Dashboards teilen beschrieben.
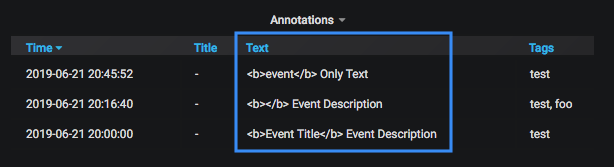
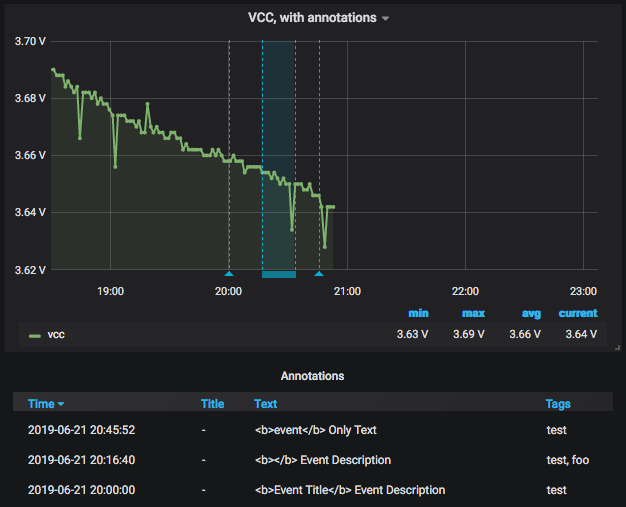
Screenshot
Beispiele
Annotationen auf Zeitpunkte
# Create point-in-time annotation at now(), with title.
grafannotate --uri https://username:password@swarm.hiveeyes.org/grafana/api/annotations --tag test --title "Event Title" --description "Event Description"

# Create point-in-time annotation at specified time.
grafannotate --uri https://username:password@swarm.hiveeyes.org/grafana/api/annotations --tag test --description "Text only" --start 1561140000 --end 1561140000
Annotationen auf Zeitbereiche
# Create time-region annotation from start to now().
grafannotate --uri https://username:password@swarm.hiveeyes.org/grafana/api/annotations --tag test --description "Text only" --start 1561140000

# Create time-region annotation from start to end.
grafannotate --uri https://username:password@swarm.hiveeyes.org/grafana/api/annotations --tag "test" --tag "foo"--description "Text only" --start 1561141000 --end 1561142000
Entwicklung
Bei Erschließung von Annotationen im Grafana per "grafannotate".