Hi Andreas. I continued some test with the Adafruit_Zero FFT and I2S libraries. I was utterly confused for a while, but then it turned out that something was wrong with the hardware (I should perhaps up my ESD safe working habits) as the microphone output had no relation anymore to the sound coming into it. I had another one (ICS43434 this time) sitting around, and with that one things made sense again.
This one doesn’t show the jumps in the spectrum seen earlier. It looks promising. Though, the difference is not understood.
A small update: I did extensive testing with the Adafruit_ZeroI2S library and the new ICS43434 and I don’t see any of the issues noticed earlier with the Arduino I2S library:
The spectrum looks nice and clean, without these half, quarter, etc, jumps shown earlier in this thread.
The spectrum looks the same for code w/ and w/o LMIC.
LMIC joins the network nicely, even if I don’t disable the I2S code temporarily.
W.r.t. to the latter comment: on this particular hardware the issue of not being able to join TTN with I2S active was not seen anymore. In contrast to an earlier set of hardware with different I2S microphone and perhaps different crystal in the MCU. So, it’s not to say if Adafruit_ZeroI2S.h is better or worse in that respect.
One more comment: Adafruit_ZeroI2S.h doesn’t implement DMA for the SAMD21. I would imagine that for small sample sizes, recorded in an intermittant non-streaming manner, DMA is not really needed. @Andreas, does that thinking make sense?
Finally, Adafruit_ZeroFFT.h does its magic on 16 bit data, whereas the microphone delivers 24 bit data. Compressing the range of the microphone data in 16 bits is easy enough, so not really an issue. For the moment I am quite happy that it now finally seems to work fine, so I won’t yet start looking into the FFT algorithms provided in arm_math.h that operate on q31_t type data.
UPDATE: GitHub - wjmb/FeatherM0_BEEP is now public. Please note that it is work in progress code. Please comment if you’d feel it could be improved in one way or another!
@Diren, thanks for the BeABee files ! I tested my code quite a bit and feel confident that it works as needed, so yesterday I played “miks boden-04-may-16-00.wav” via a headphone to my node in order to check how the thing would respond to real bee-sounds. While looking at the data coming out, I was wondering about signal to noise and how to deal with that.
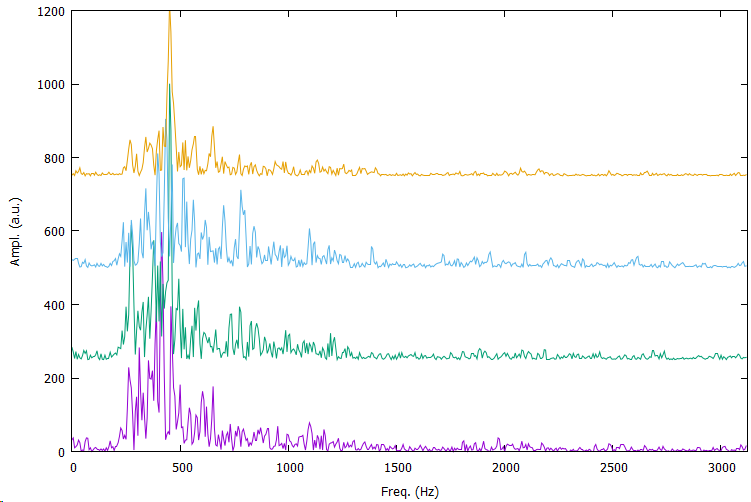
Although I have no way to calibrate the sound pressure level coming out of the headset into the microphone, I do believe I played it at a reasonable volume. I sample the microphone with 6250 Hz and take 1024 samples. On that data I do a FFT. The spectrum looks quite noisy; in fact, too noisy to do the analysis of comparing different bins and getting consistent results. Here is a picture, to give you a sense of the signal:
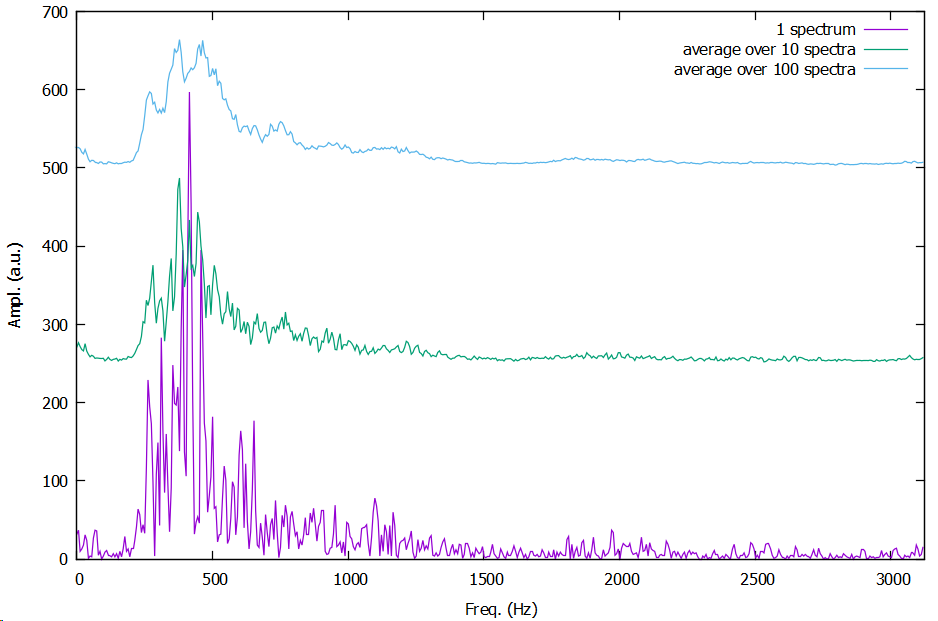
In previous tests, my remedy to this was to take a number of spectra and just average over these. But, how many spectra to take and average over? The picture below shows averaging over 10 and 100 spectra.
Is there some way to determine when the signal to noise is decent enough? Are there other methods than simply taking n spectra and lumping them together? Something that doesn’t require a lot of memory.
Probably this is simple stuff for anyone skilled in the art of dealing with noisy data … I would love to get a few pointers on what to try!
after some trips to other clearings in our ecosystem I’m just coming back to this. Thank you so much for the effort and spirit you are putting into this and great to hear you have been able to make that kind of progress.
Unfortunately, I’m not able to go through all the details right now and I don’t even know if I would have appropriate answers on the analysis aspects. If you feel there are still infrastructural aspects you might need my assistance for, please let me know.
Thanks for that!
About the other things you were asking:
I hear you. However, I’m not a signal guy either. Would computing the RMS level make some sense at this place? Maybe @weef or @tiz could contribute some suggestions here? Thanks already!
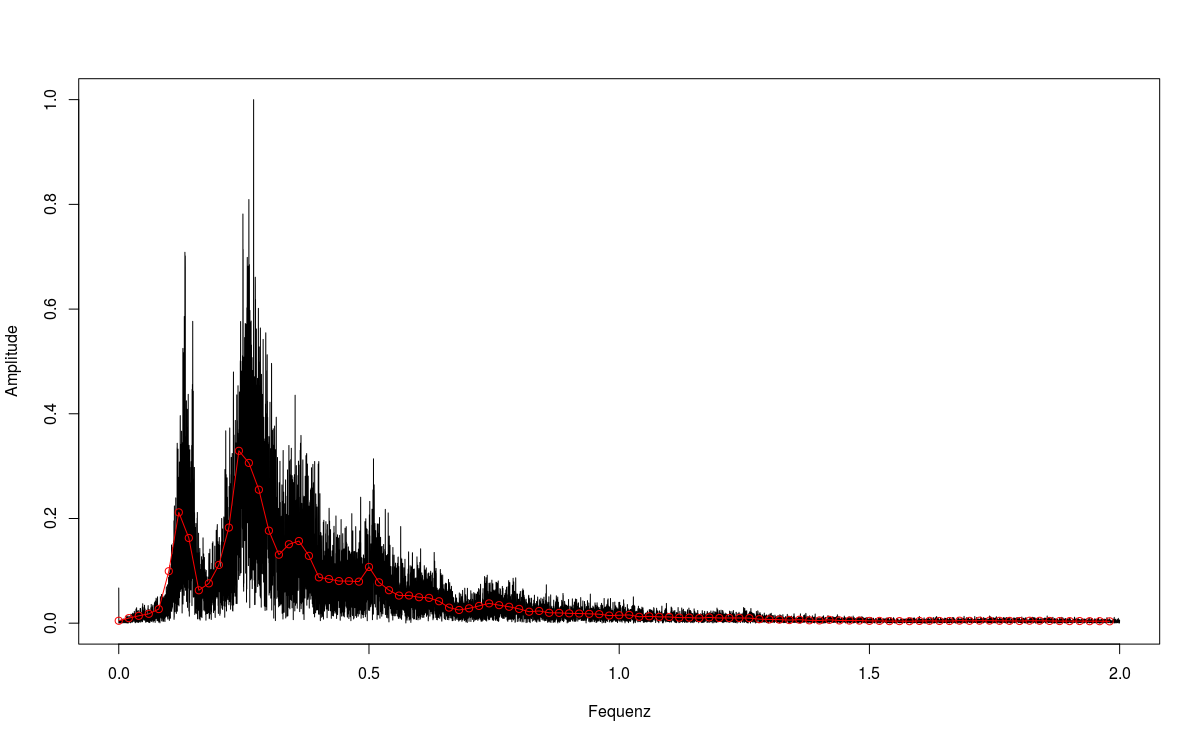
In fact, the results of my FFT also look quite noisy (black line).
Especially for plotting, I only save the mean value of 20 Hz frequency bands (red dots).
The plot shows the spectrum of the first 10 seconds of “miks boden-04-may-16-00.wav”.
I think we did not use the same audio snippets, but it seems that your approach works well and the results make sense, even though you rerecorded the audio!
I would say this really depends on the method you want to use. As you showed, it is important for the algorithm developed by the people in Kursk.
It also really depends on the amount of data that can be send via LoRa and if you want to run a Machine Learning algorithm at the node or some server. Deep Learning algorithms should be able to deal with a “bad” (low) signal to noise ratio. If they are pretrained, they could even run at the node.
Also, if you just use the spectrum to calculate something like the mean frequency, the signal to noise ratio is not that important.
Potentially, the noise even contains some information.
Probably yes, but I guess if your approach works, it works ;)
Not sure how much memory you want to use, but in general possible approaches could be bin smoothing, polynomials or some sort of splines, e.g. penalised regression splines.
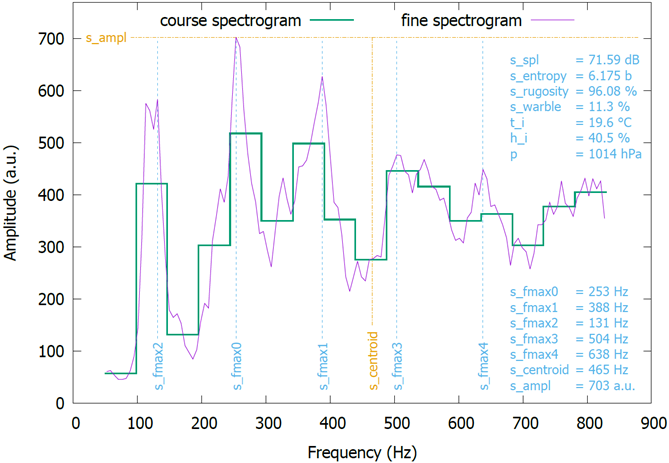
In the end I decided to use simple averaging of spectrograms. The node records at 6250 Hz for 1024 data points. From this audio data the FFT is calculated (in 6.1 Hz wide bins). This is done some number of times (e.g. 100) and these FFT’s are averaged. In the figure below this is shown as “fine spectrogram”, which is kept internal to the node and not sent over LoRaWAN. Instead, from that average spectrogram, several quantities are calculated, as listed in the graph. Among these is the “course spectrogram”, which is obtained by lumping eight “fine” bins together into one “course” bin.
Somehow I have pretty high hopes for the s_fmax quantities, which represent the one global and another four local maxima in the spectrogram. It will be interesting to see how these evolve over time after I insert the node into one of my hives.
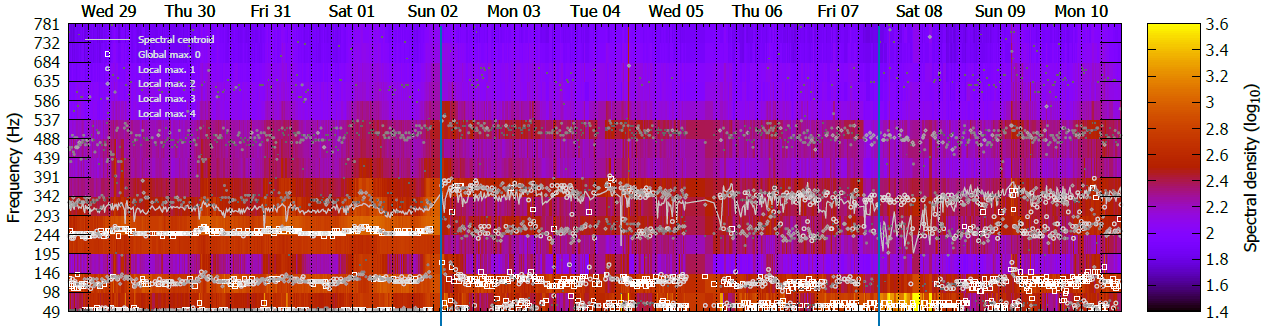
Hi, here is some first data coming out of my new node put together in one overview by means of GnuPlot. I just put all there is in there, so it has become a bit complex.
the top graph shows the spectrum in false colours, as before.
the points superimposed on it are the local maxima in the spectrum at a given time: light coloured open square is the global maximum, the somewhat darker and smaller open circle is the second maximum, the yet darker/smaller diamond is the third, smaller pentagon the fourth and the darkest dot the fifth maximum. The continuous line is the spectral centroid.
In the middle pane the (uncalibrated) sound pressure level in dB. Warble is the fraction of signal in the 225-285 Hz spectral range. Rugosity is a measure for the “roughness” of the sound. Entropy is the spectral entropy in bits.
In the bottom pane the pressure is just the air pressure. Temperature and humidity are measured inside the hive too.
The weather was quite dark and cold last week. I think it is nice to see that a bump in humidity seems related to nectar flow (as also know from literature). Furthermore, some of the spikes in the audio data are related to occasional hail or rain.
BTW, I am now part of the B-Good EU Horizon 2020 project (they send 3 connected scales and will collect data from my apiary) and I know they do audio analysis. Does anyone know if this is connected to the Hiveeyes audio analyser. How can I get more information on what has been done by Hiveeyes in term of audio analysis and what the results are ?
Thanks !
-Henri
As I remember Beep uses only around 10 FFT bands to get the raw audio analysis results transported through TTN. For my feeling too less and to imprecisely for prediction or an “audio sensor”, but much better than nothing!
@clemens, @hsors, Recently I haven’t been able to spend a lot of time on this. I did play around with various algorithms running on the sensor node itself (in adddition to the FFT) in order to get some additional information about the spectrum other than the coarse frequency bands send via LoRa.
One of the ones I liked best in the end was a peak detection algorithm using persistent topology (see e.g. Persistent Topology for Peak Detection). The data output (the n most important peaks, where I used n=4) is quite robust. However, other priorities kept me from exploring this further for the time being.
Here is an example of the data coming out (with the 4 local maxima indicated at various little squares/diamonds/etc). What struck me as difficult to deal with is the acoustics of the hive itself. The first mark on the horizontal axis is where I place an extra chamber on the hive. Note how this completely changes things. The second mark is to designate a storm and the resulting sound that is being picked up (the hive was placed in the open field).
And, to illustrate the difference in acoustics, here is a side-by-side comparison for two days where the weather was quite similar. Despite the hive being two weeks older and foraging conditions might have changed a little, I think the differences seen between the two days are mostly a result of the differences in acoustics as a result of adding another chamber to the “spaarkast”.
Interesting ! I’ll dig into that when I have more time. In term of actionable data, is there is there any conclusion as of today or is it still work in progress ? @wjmb: are you also supporting the B-Good project ?
-Henri
I had a call about that with Marten from Beep last week. They are still using the audio setting from Wouter / @wjmb that means only ~10 FFT bins for audio but combin this data with additional sources like weight, temperature but also the insprections from the beekeeper in the beep app to get more informaiton out in a “big data” approach. Some universities in the B-Good projekct are involved in this audio plus other data analysis.
Hi Henri, @clemens, @Andreas, my relationship with BEEP is informal and I was never involved in any B-Good details. I am not sure which partner in the project is doing the audio stuff. @marten.schoonman will be able to give more details on that.
I did have a good overview of the available literature and methods back in 2019, but didn’t keep it up to date. Nevertheless, let me know if I can be of help.
When BEEP is involved, their part will hopefully be open source anyway. I dearly hope that resources from other partners within B-GOOD will be handled and published in the same spirit.
The audio acquisition and FFT part is in the firmware repository:
In today’s Beep 2022 event a picture was posted about the B-Good project.
For audio monitoring the mic is mounted on the floor of the hive. So it can also pick up more noise from outsid, especially with a mesh at the floor.
A big variation sounds for me not too bad, in case we expect a lot of informaion from audio this information must be “stored” somewhere. So a new super makes bee moving top and makes room so it could also be a good indicator to have information in this data.