After Getting started with Flux, you might be asking how to finally use it from Grafana?
Grafana datasource plugin for Flux (InfluxDB)
Introduction
Use this datasource if you want to use Flux to query your InfluxDB. Feel free to run this datasource side-by-side with the non-Flux datasource. If you point both datasources to the same InfluxDB instance, you can switch query mode by switching the datasources.
State of the onion
While we already assumed to require the »Grafana datasource plugin for Flux (InfluxDB)«, there are currently two versions around:
- Flux (InfluxDB) [BETA] plugin for Grafana | Grafana Labs published on the Grafana Plugin Repository is on version 5.1.0, while
- the GitHub Repository GitHub - grafana/influxdb-flux-datasource: Grafana datasource plugin for Flux (InfluxDB) is on version 5.2.6 already.
We should use the most recent one. However, there is another commit Updated db: to bucket: to support new changes in Flux · grafana/influxdb-flux-datasource@ac49cf7 · GitHub sitting in the branch “bucket-updates” which most notably includes the switchover regarding addressing databases from within a Flux expression. Flux switched from
from(db: "${database}")
to
from(bucket: "${database}")
So, databases will be called buckets now. That’s ok.
Setup
Prerequisites
curl -sS https://dl.yarnpkg.com/debian/pubkey.gpg | sudo apt-key add -
echo "deb https://dl.yarnpkg.com/debian/ stable main" | sudo tee /etc/apt/sources.list.d/yarn.list
apt update
apt install yarn
– https://linuxize.com/post/how-to-install-yarn-on-debian-9/
Build
git clone https://github.com/daq-tools/grafana-influxdb-flux-datasource /opt/grafana-influxdb-flux-datasource

cd /opt/grafana-influxdb-flux-datasource
yarn install
yarn dev
Activate
Note: Please make sure you uninstalled the GA release from the Grafana Plugin Repository by using e.g.
grafana-cli plugins uninstall grafana-influxdb-flux-datasource
Then, link the DEV release into the Grafana plugin directory:
ln -s /opt/grafana-influxdb-flux-datasource /var/lib/grafana/plugins/
systemctl restart grafana-server
Configure
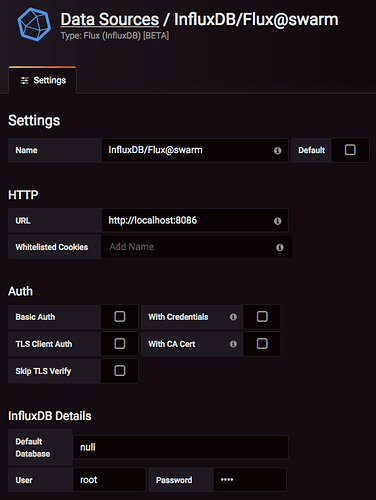
Datasource
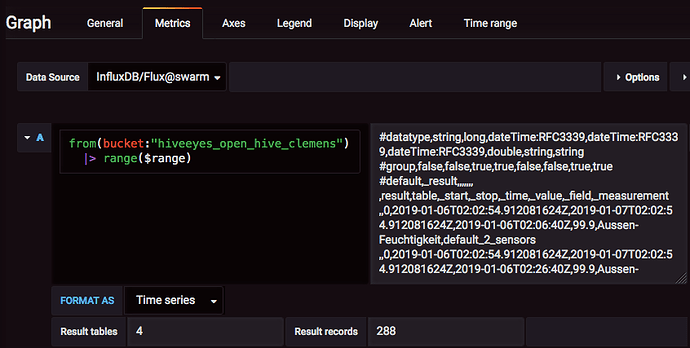
Panel metrics
Note
Please note there’s no need to configure a default database (so we used "null" there), as the database (bucket) is addressed from within the Flux query expression anyway. Thus, there will be probably no need to configure a different Grafana data source for each InfluxDB database - every query can be run through the canonical one, right?
Important note about Flux (again)
Flux requires a time range when querying time series data. “Unbounded” queries are very resource-intensive and as a protective measure, Flux will not query the database without a specified range.
When sending an “unbounded” query to InfluxDB through Flux, like from(bucket:"hiveeyes_open_hive_clemens") without the range($range) part, it will respond appropriately:
Failed to create physical plan: result 'from0' is unbounded.
Add a 'range' call to bound the query,


