Queen piping: Visualization and analysis

Introduction

We extracted a part from Tim Williams’ Sound Inside a Swarming Bee Hive -25 to -15 minutes where the piping of a queen is clearly audible. Enjoy!

Audio


Download: queen-piping.ogg

The selection is:

Start: 0m54.000s
End:   1m15.000s

Spectrogram

We also tried to make it visible by creating a spectrogram using Audacity:

The spectrogram settings are:

Scale

Scaling:         Linear
Frequency range: 0-3000 Hz

Colors

Gain:            40
Range:           90
Frequency gain:  20

Algorithm

Algorithm:       Frequencies
Window size:     1024
Window type:     Welch
Zero padding factor: 4

OSBH audioanalyzer

$ audiohealth analyze --analyzer tools/osbh-audioanalyzer/bin/test --audiofile samples/queen-piping.wav --strategy lr-2.0

Duration: 21s
Strategy: lr-2.0

==================
Sequence of states
==================
swarm, swarm

===================
Compressed timeline
===================
  0s -  20s   swarm           ==

==============
Total duration
==============
        20s   swarm           ==

======
Result
======
The most common events (i.e. the events with the highest total duration) are:

     The colony is mostly in »SWARM« state, which is going on for 20 seconds.
2 Likes

After the piping sound of the tooting queen which is concisely audible, there seems to be a lower, more gentle sound. Could it be the (quacking) answer from another queen which is still in her cell?

As far as i know from reading some information, the queen which is not hatched yet will probably get stung from the designated virgin queen. I’m happy to learn what exactly might go on here as i’m not a beekeeper (yet). I believe others are curious as well :-).

Have fun!

1 Like

Hey, hey YET!! When is your birthday? We will flood you with beekeeping equipment! ;-)

There is an interesting thread about “Tüten und Quaken” (in german) Tüten und Quäken - Fragen, Hinweise, Tipps und Ratschläge, nicht nur für Einsteiger - Imkerforum seit 1996 but let me paraphrase some highlights:

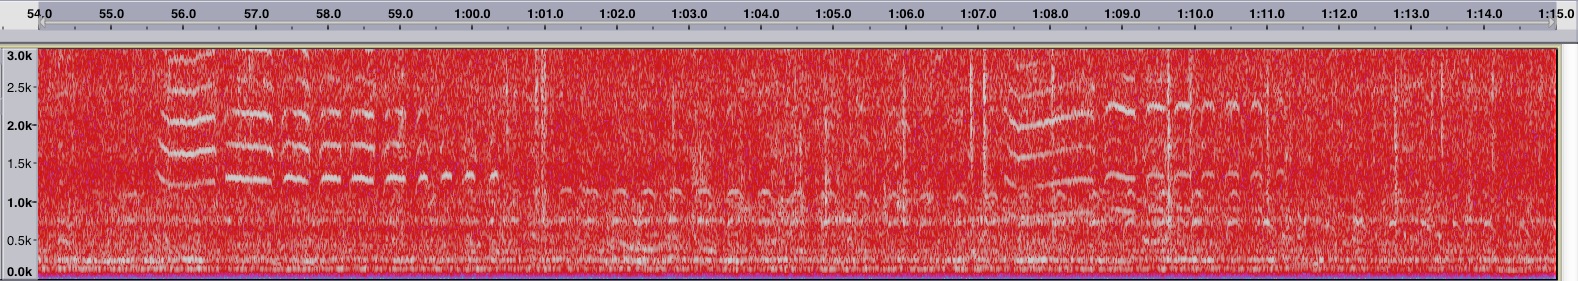
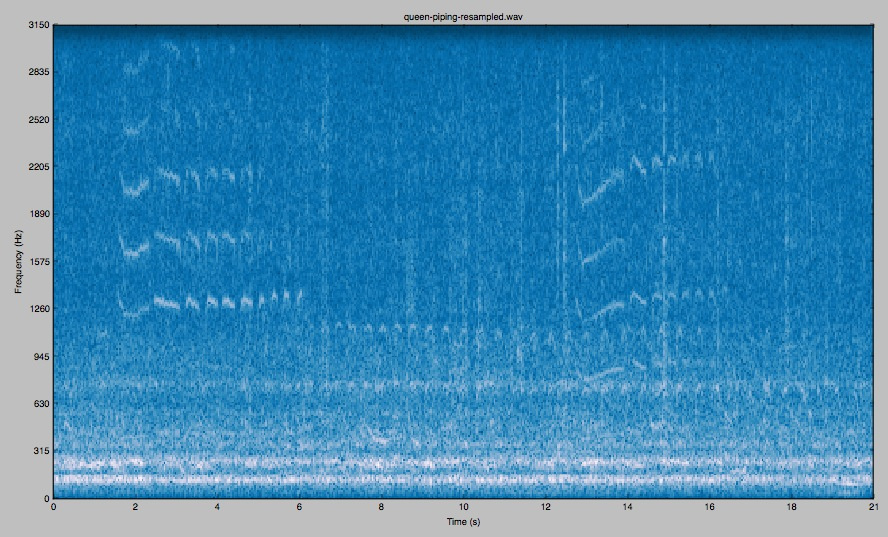
Especially the research outcome from Seeley published in “Honeybee Democracy” is relevant: On page 41 is a graph with “toot” an “quack” on a timeline. Unfortunately without exact numbers for the frequencies.

The “toot” from the emerged queen and the phase is in the graph 2-6 seconds long with short breaks (< 1 s) in between. “Quack” is about 1 sec with also 1 sec break. In the graph about 20x repeated, this is from the not yet emerged queen. .

Some frequency numbers and sound examples I got http://www.lcbaor.org/piping.htm But unfortunately with a broad Hz range:

A “toot” is produced by a queen that has emerged from her cell and is moving freely within the nest. […]
Toot: Typical duration: 5 sec single long syllable followed by several short syllables. fundamental frequencies from 350 - 550 Hz

A “quack” is produced by a queen that has pupated into an adult, but remains imprisoned in her cell. […] Quack: Typical duration: more than 10 sec long, series of short syllables. fundamental frequencies from 200 - 350 Hz

Woods / Boys https://beedata.com.mirror.hiveeyes.org/data2/listen/listenbees.htm reports three different piping formats of the queens:

  1. The emerged - after the swarm is gone - virgin queen makes a “‘full round hoot’ or a ‘whoo‑whoo’” with "340 Hz at first, falling slightly as the wings harden.
  2. The imprisoned queen can make from 5 days after covering with 450 Hz “a feeble bleat which also falls as she approaches emergence”

He describes also the rarely situation when the (old) queen can not swarm because of bad weather conditions:

Clearly, piping usually occurs after a swarm has departed; the old queen does not challenge an immature one in her cell. However, there may be occasions when bad weather delays the emergence of the swarm in which case young queens may find themselves near the old lady, whose pipe was described by Eddie as a “quark”. (a cross between a quack and a squawk?) It also varies in volume depending on the extent to which her tracheae are distorted by egg‑full ovaries.

You can find a more detailed description what is going on before and after swarming in this posting (sorry, german!) from me:
https://www.imkerforum.de/forum/thread/29251-tüten-und-quäken/?postID=315832#post315832

And a second one about worker piping from the scout Bees immediately before swarming out:
https://www.imkerforum.de/forum/thread/29251-tüten-und-quäken/?postID=315058#post315058

Worker piping could be the biological base for queen piping but this is just a theory. From the signals it could be similar the queen piping so we should have it in mind while analyzing bee colony’s pulsing sound.

We see in the spectrogram the relevant range from “quack” 200 - 350 Hz to “toot” 350 - 550 Hz not or only hard. Perhaps a detailed visualization of this frequency range is in this case better.

But the seeable output is nevertheless impressive. But it must be overtones, see Die Obertonreihe not the origin sound produced by the queen.

Why did you use Audacity in this case? Wasn’t it possible / seeeable with the “default” and scriptable sox command line / batch method?

To find good places with piping/quacking parts, we used Audacity to investigate the whole audio recording interactively while looking at the spectrogram. After finding an appropriate section, we started to play around with the spectrogram settings. By tweaking the gain and range parameters for colorization as well as the FFT algorithm settings, the piping/tooting/quacking syllables became clearly visible without being distorted by background noise or dominated by the general humming around 250 Hz, which is way louder.

Of course, we would like to have this thing produced by non-interactive tooling. We don’t think this is possible using the very basic one-liner using sox we used to produce the spectrogram the other day, so we should put more effort into investigating how to produce spectrograms using SciPy/NumPy, robust enough to be used by anybody.

Right now, we are playing around with spectrogram generation using aubio, which is a C library with Python bindings in turn based on NumPy. The generated spectrogram will get visualized by matplotlib using different colormap normalizations. See below for the first results.

We will share the code by putting it into the audiohealth sources and will be happy if someone with more signal processing know how and NumPy experience would get hands-on with it to improve visualization and maybe dive into analysis. It would be cool if we could detect the piping and quacking patterns automatically, right?


norm = colors.PowerNorm(gamma=0.25)
cmap = 'PuBu_r'

norm = colors.PowerNorm(gamma=0.25)
cmap = 'gnuplot2'

norm = colors.SymLogNorm(linthresh=0.08, linscale=0.1, vmin=specgram.min(), vmax=specgram.max())
cmap = 'inferno'

Yes, the harmonics became very clearly visible after playing around with the spectrogram settings. That’s why we wanted to emphasize and display it, right. We will deliver other spectrograms just limited to the 0-1500 Hz frequency range.

The apparent problem is that the humming or other noise in the lower frequency range between 200 Hz and 550 Hz has more energy, so we can’t see any characteristic piping pattern there.

Maybe @weef can enlighten us more about the acoustic background or give further guidelines about how to tackle the problem of getting hold of the origin sound produced by the queen.

Added per commit 7f0df5d5. We used the “inferno” color mapping scheme as default. Have fun!


… and again:

Nice article (sorry in German) about the biological function of queen piping, see: Artikel "Warum Königinnen quaken und tuten"