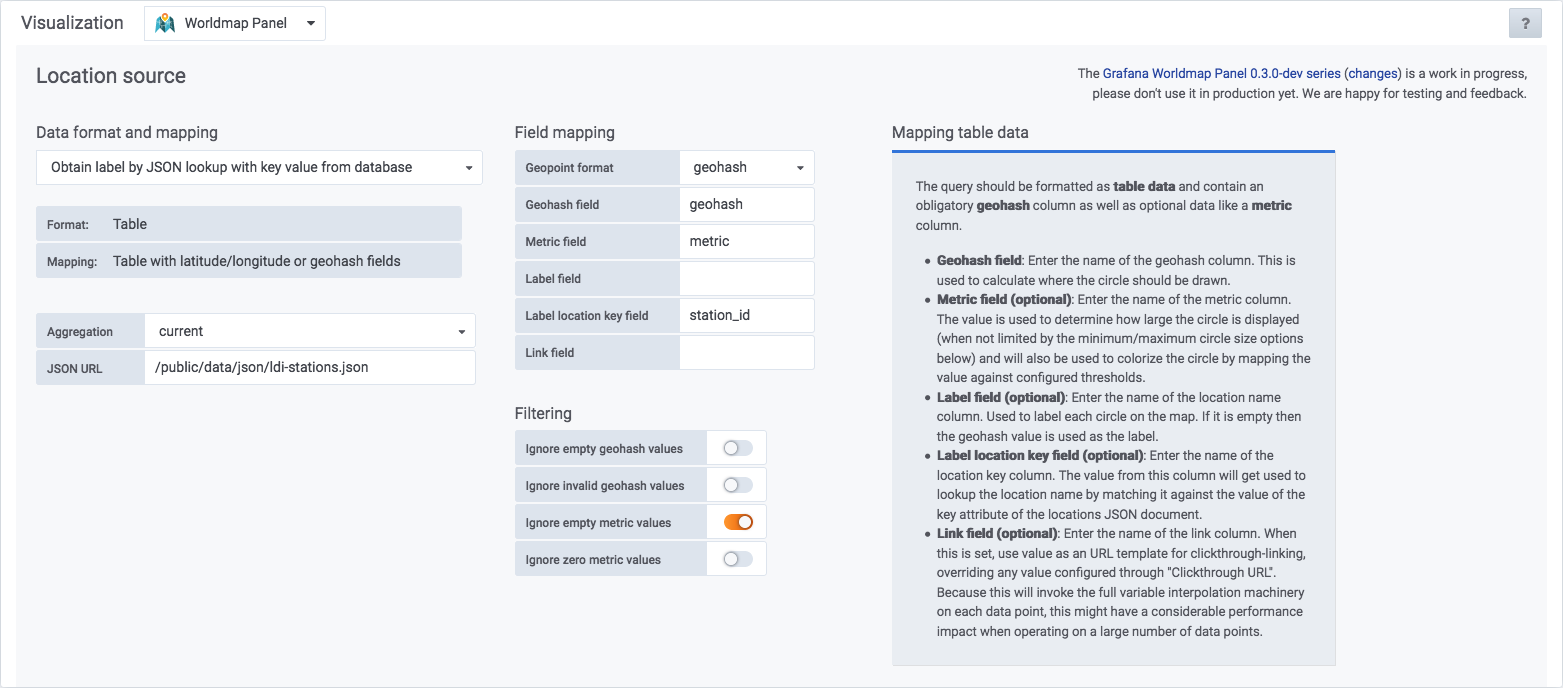
Last but not least, the editor view layout has been adjusted to account for the growing number of settings. While being at it, some controls and their mechanics have been improved.
The number of features and the corresponding editor options already made learning and operating this panel slightly cumbersome. This humbly tries to bring in some fresh air to the user interface in order to improve this situation and make things more clear to the operator.
This turned out to be a major refactoring and improves the plugin across the board. The editor user interface now is way more clear about what it is aiming at and its interactivity got improved to support the operator while tuning its knobs.
Along the lines, appropriate exception and error handling has been introduced to signal error conditions and warnings to the user which helps tremendously when configuring and operating this plugin.
Screens
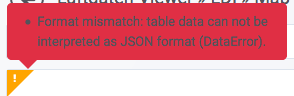
These are pairs of “invalid setting” <=> “user warning” each. It should give you an idea what this is all about.
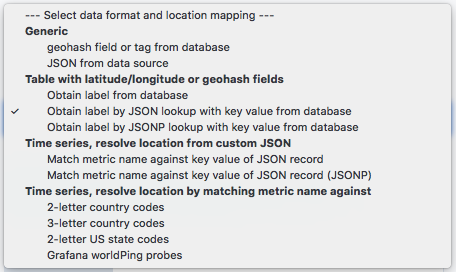
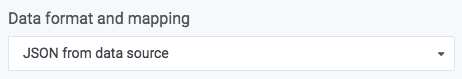
Wrong data format selected
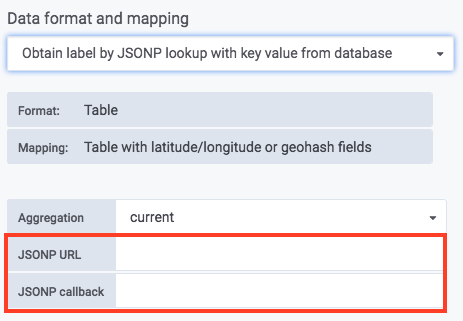
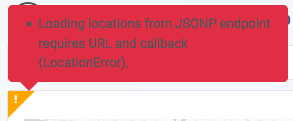
Parameters missing
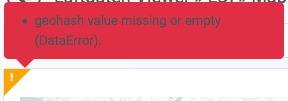
Wrong field names
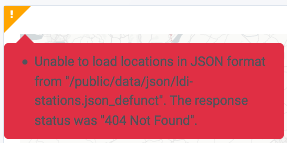
Failed JSON responses
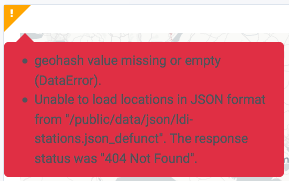
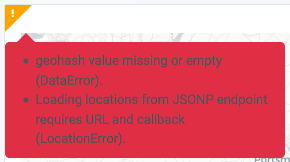
Multiple error domains
As misconfiguration might have happened at different places and advanced processing sequences might emit notifications at different steps, there might even be multiple error messages originating at different parts of the plugin – let’s call them “application domains” or “subsystems”. Both of the examples below demonstrate this well where one message is originating at the “data domain” and the other one at the “location domain” of the Grafana Worldmap Panel.
Being implemented through a generic ErrorManager, the general idea and main part of this humble notification subsystem might be considered to be used for other plugins as well.
Outlook
Currently, we are using the designated tooltip drop in the upper left panel corner as this is the place Grafana users are accustomed to. However, this might change in the future to display some of this information in the editor view only as some details might have to be hidden from the average user while still being visible to the panel operator.
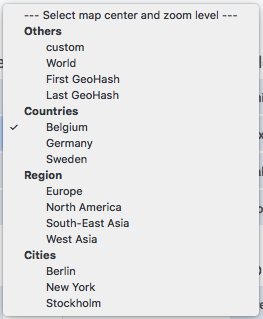
I’d like to define a “max zoom-level” when “fit to data” is enabled. Background: We are drawing two “selected stations from different networks” side-by-side. These might be some blocks away, the default max. zoom-level won’t help for orientation.
We wanted to let you know that the development of the improved Grafana Map Panel already has moved on to the Panodata Initiative. You might enjoy reading about all new features and improvements on its new canonical documentation page.
Setup
Installing the most recent version of the Grafana Map Panel is easy as we are now building and publishing installation packages. Instructions are outlined within the documentation section Setup Grafana Map Panel.
Outlook
We will be happy to receive further contributions from the community and would like to encourage you to send pull requests to this repository we are trying to maintain steadily. We will also be happy to see you join the discussion about Developing Grafana Map Panel or just follow the development process.